Choosing the Right SSD for a Skylake-U System
by Ganesh T S on May 9, 2016 8:00 AM EST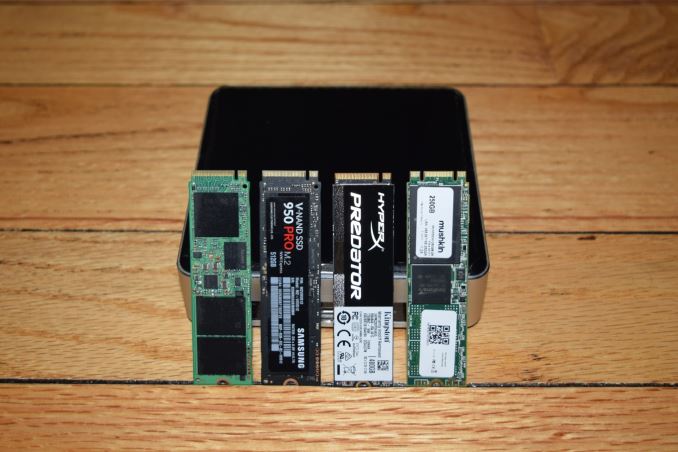
Our Skylake NUC review had a brief section on the performance of the storage subsystem. The comments section raised a few questions about the inability of SSDs such as the Samsung SSD 950 PRO to achieve maximum performance in the NUC. After some discussion with Intel, we discovered some interesting aspects in the design of Skylake-U systems that have a bearing on the performance of some M.2 PCIe SSDs. These can affect the consumer's choice of SSDs for a Skylake-U system - be it a NUC or an user-upgradeable notebook.
Background
Intel has a wide range of CPUs based on the Skylake microarchitecture. These target a variety of markets ranging from tablets / 2-in-1s and Compute Sticks to the traditional tower desktops. The same microarchitecture is able to serve different markets because of the scalable nature of the TDP / power envelop (from 4.5W to 91W).
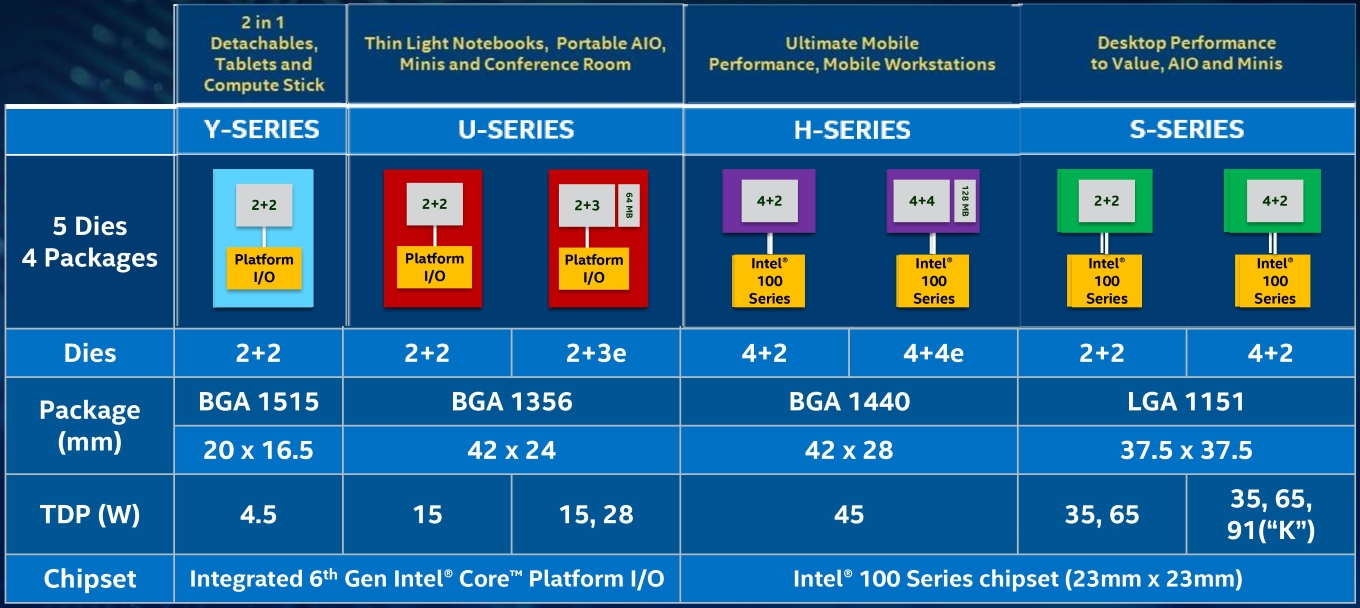
While the high-performance H-, S- and K- CPUs need a separate Intel 100 Series platform controller hub (Sunrise Point PCH), the Skylake-U and Skylake-Y are Multi-Chip Packages (MCP) that have the Sunrise Point-LP PCH die integrated with the CPU in a single package.
The communication between the CPU and the PCH in the H-,S- and K- systems is via the Direct Media Interface (DMI 3.0),a proprietary link protocol developed by Intel. Skylake-U/-Y series processors, on the other hand, have an On Package DMI interconnect interface termed as OPI. Unlike DMI 3.0, the OPI in Skylake-U/-Y can be configured to meet the desired power or performance needs of a mobile system design. The following table summarizes the differences between DMI and the two configurable OPI options in Skylake systems.
| Skylake CPU - PCH(-LP) Communication Link Characteristics | |||
| Aspect | DMI 3.0 | OPI GT2 | OPI GT4 |
| Applicable Systems | Skylake-H/-S/-K | Skylake-U/-Y | |
| Link Width | x4 | x8 | |
| Transfer Rate per Lane | 8 GT/s | 2 GT/s | 4 GT/s |
| Max. Theoretical Bandwidth | 3.94 GBps | 2 GBps | 4 GBps |
For all practical purposes, DMI 3.0 and PCIe 3.0 are equivalent, and this is important when a PCIe 3.0 x4 SSD is connected to the a Skylake-H/-S/-K system using PCIe lanes from the PCH. Any other peripheral communicating with the CPU at the same time as the PCIe SSD would end up creating a bottleneck at the CPU-PCH link. On the other hand, Skylake-U/-Y systems that have a PCIe 3.0 x4 SSD connected to the Sunrise Point-LP PCIe lanes will be directly impacted by the configuration of the OPI. The GT4 configuration should have enough bandwidth to get full performance from a PCIe 3.0 x4 SSD, but a GT2 configuration could end up throttling such a device.
Analyzing the Skylake NUC6i5SYK Storage Subsystem
In order to determine whether the Sylake NUC6i5SYK is affected by the OPI capabilities, it is essential to understand the board design and the way each of the peripheral ports connect to the CPU.
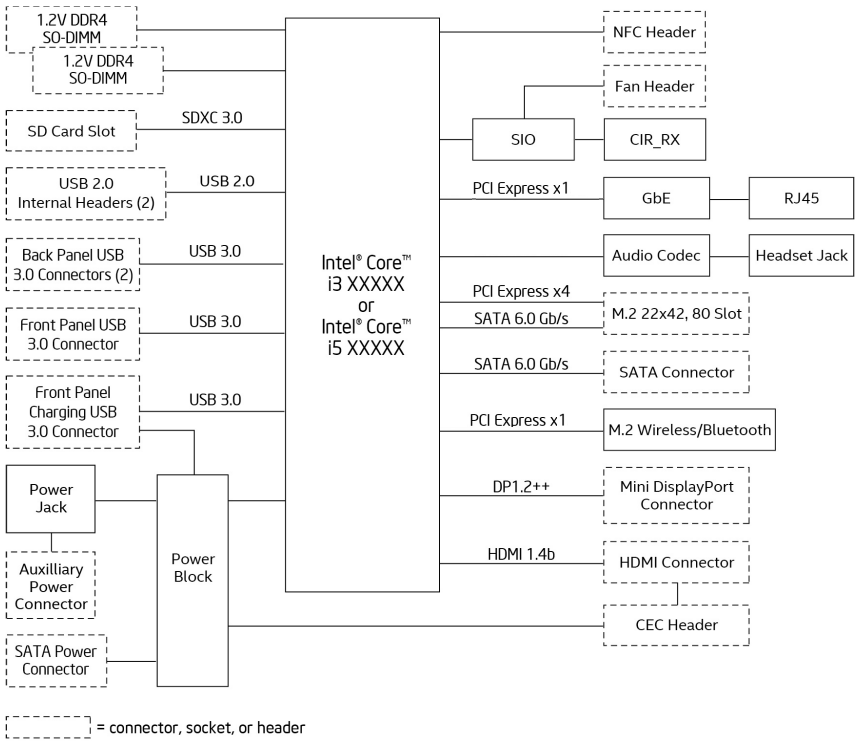
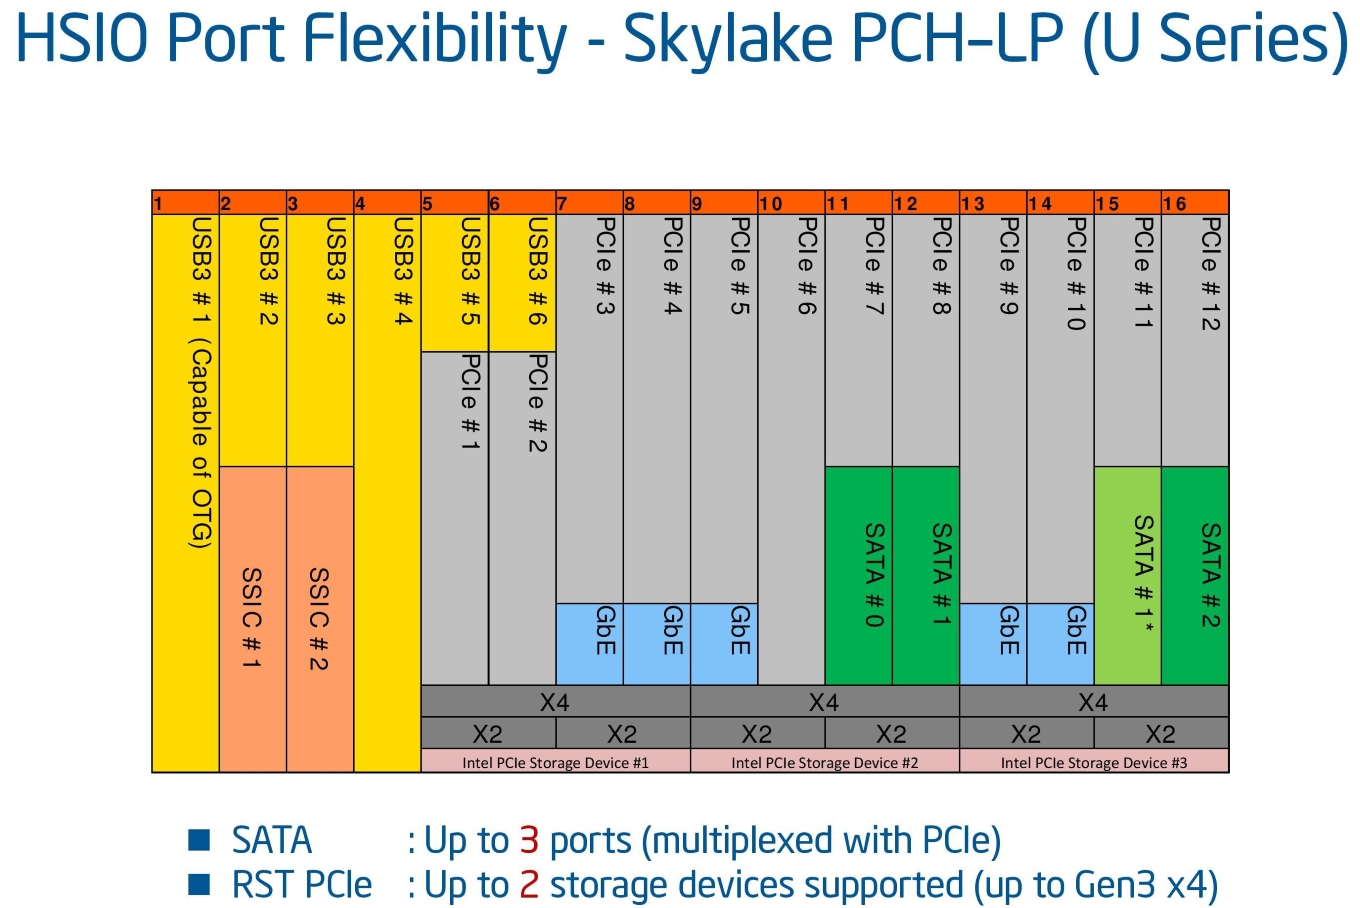
The above block diagram should be considered in conjunction with the Skylake PCH-LP high-speed I/O (HSIO) configuration options depicted below. One of the x4 links multiplexed with a SATA lane is used for the M.2 22x42,80 SSD slot. One of the PCIe lanes that gets multiplexed with GbE is connected to the Intel I-219V Ethernet Adapter., and yet another PCIe lane is used for the WLAN adapter. The important aspect to note here is that any M.2 SSD can have full PCIe 3.0 x4 connectivity to the Sunrise Point-LP PCH.
Intel's current technical documentation (PDF) for the Skylake NUC board mentions that the maximum possible performance for any M.2 SSD is around 1600 MBps. The Samsung SSD 950 PRO and SM951 PCIe 3.0 x4 NVMe SSDs claim performance numbers in excess of 2000 MBps. This obviously means that there is a bottleneck between the Skylake CPU and the Sunrise Point-LP.
Intel's Skylake-U/-Y reference designs are optimized for lower power and default the OPI to GT2 rates. In the development of the NUC6i5SY product family, the Intel team utilized the reference designs and default settings for the OPI and GT2 rates. Therefore, PCIe 3.0 x4 SSDs connected to the M.2 port of the NUC6i5SYK (BIOS v0042) are effectively limited to PCIe 2.0 x4 rates. This throttling makes sense for battery-operated devices like 2-in-1s, but, not so much for UCFF desktops like the NUCs.
After we brought this to Intel's attention, the development team decided to complete the necessary changes and validation to support the maximum PCIe 3.0 performance. Intel sent over a development BIOS (v1142) that turned on the higher performance OPI GT4 rate. This BIOS is scheduled to be made public before the end of May 2016 (after completion of internal validation).
Evaluating the NUC6i5SYK Storage Subsystem
The rest of this review deals with two major aspects - a quantitative measurement of the effectiveness of different types of SSDs in the Skylake NUC, and an evaluation of the improvements resulting from ramping up the OPI to GT4 rates (i.e, a comparison of the performance using BIOS v0042 and BIOS v1142). In order to do this, we processed various benchmarks while keeping everything other than the M.2 SSD and the BIOS version constant.
| Intel NUC6i5SYK Benchmarked Configuration | |
| Processor | Intel Core i5-6260U Skylake, 2C/4T, 1.8 GHz (Turbo to 2.9 GHz), 14nm, 4MB L2, 15W TDP |
| Memory | Corsair CMSX16GX4M2A2400C16 DDR4 15-15-15-35 @ 2133 MHz 2x8 GB |
| Graphics | Intel Iris Graphics 540 (Skylake-U GT3e) |
| Disk Drive(s) | Various M.2 SSDs |
| Operating System | Windows 10 Pro x64 |
| Full Specifications | Intel NUC6i5SYK Specifications |
The various benchmarks presented in the next few sections were all processed with the M.2 SSD as the primary drive. The drive was initialized with two partitions. The primary OS partition was set to be 120GB in size, while the remaining space was allocated to the secondary partition. Both of the partitions were formatted in NTFS with default settings.
In the next section, we will first take a look at the specifications of the four M.2 SSDs that were evaluated in the NUC6i5SYK, along with CrystalDiskMark scores for each in both the BIOS versions. Following this, we move on to real-world benchmarks - SYSmark 2014, PCMark 8 Storage Bench and a slightly tweaked AnandTech DAS Suite. Prior to our concluding remarks, we take a look at a few miscellaneous aspects - power consumption, thermal characteristics and pricing.


40 Comments
View All Comments
AnnonymousCoward - Monday, May 9, 2016 - link
When will AnandTech realize that synthetic hard drive benchmarks are utterly pointless?http://techreport.com/review/29221/samsung-950-pro...
It's not like you'd round up several graphics cards that produce the same fps, and only run synthetic tests on them to try to show which is fastest. That would be foolish. And that's what's being done with SSDs.
You go as far to claim "those involving heavy multimedia editing and frequent transfers of large-sized files, the PCIe SSDs can definitely provide tangible benefits." How do you know?? If you look at the actual data (in the techreport site), load times of 500-800MB files were pretty much a wash across all the drives. You're misleading readers by only showing PCMark8 and claiming there are tangible benefits.
ganeshts - Monday, May 9, 2016 - link
Dude, did you even read the full article - particularly, the place where the graphs for the 'AnandTech DAS Suite' are displayed? Those graphs are the places where tangible benefit is shown for the PCIe SSDs.In fact, the only place where I have put in 'synthetic hard drive benchmarks' was the CrystalDiskMark comparisons when introducing the four SSDs. Again, that was prefaced with this text: "...it is useful to determine whether the SSDs are operating as per the manufacturer's claimed specifications. It can also help in finding out whether the SSD is connected via the most optimal interface. ..."
In fact, we set out with this article with the sole intention to use ONLY real-world, application-based benchmarks. Please read the article at least once before putting forward an accusation in its comments section.
AnnonymousCoward - Monday, May 9, 2016 - link
It really is a great article, it's well-written, and an interesting read. I'm only focusing on the lack of _real_ real-world benchmarks.You consider SYSmark, PCMark, and DAS to be real-world, but the problem is they aren't. First, I highly question the accuracy: in an actual load time situation, I seriuosly doubt the 950 Pro will be 5x faster than the Mushkin, as PCMark and DAS show. Secondly, these benchmark programs don't give a tangible understanding: seeing a load time difference in "seconds" is tangible, but seeing scores of a thousand is not.
It's really easy to prove this to yourself: use a stopwatch on anything with a load time. If the times are less than 3x of each other (more likely, within 10%) then it will be evident that PCMark and DAS are lying.
ganeshts - Tuesday, May 10, 2016 - link
SYSmark is real-world. Look at their whitepaper if you haven't had a chance to try it out. It actually runs the applications and keeps track of how much time it takes to complete tasks - and it actually shows there is little to no difference between a PCIe AHCI SSD operating at 2.0 x4 and a NVMe SSD operating at 3.0 x4.PCMark - I have linked the PDFs which show how much time it took to complete each workload (real-world trace). The SATA SSD takes around 2 seconds more than the NVMe SSD - and between AHCI and NVMe, it is 0.2 - 0.3s.
The DAS stuff is pretty much as real world as it can be. You have 250GB of data to transfer from one partition to another. The SATA SSD takes 4x the time of the PCIe NVMe SSD. The instantaneous bandwidth numbers are presented in the graph for you to see. Are you saying I am misrepresenting facts?
SYSmark and PCMark are _real_real-world benchmarks - as real-world as you can get if you want highly repeatable benches with reproducible scoring , not something a tech site cooks up on its own (like our DAS suite - which has its own reasons for existence - since we developed it, we can instrument it in ways not possible with third-party benchmarks).
Where does PCMark and DAS say they are representing load time situations? Did you take a look at the PDFs? The PDFs show how much difference is there for the real workload of manipulating images with Photoshop etc. The bandwidth numbers generated by PCMark - I clearly state it is artificial and assumes workload that is not CPU-bound. You should look at the Storage Score to get an idea of how much faster SSD X would be over SSD Y. The bandwidth numbers are only to indicate how the SSDs would perform in a storage-bound situation - Read the explanation preceding the graph.
The DAS suite doesn't talk about load time at all - it notes time taken to transfer a large amount of data from one partition to another. You can see your tangible 'seconds' in those graphs.
Stopwatch and stuff - at the risk of sounding like a broken watch - check the PDFs of the PCMark 8 storage bench results.
rossjudson - Tuesday, May 10, 2016 - link
I'm not sure why FIO isn't used for your benchmarking. Doesn't have the pretty graphs, but it's got scalability and rigor. You're not going to use Crystal to find out how well a PCIe SSD performs at 600K IOPS, or what happens when you're writing maximum sequential load to 4 of them in a single system."What can this hardware do?" and "How will this affect my workload?" are different questions, for sure. I think your application-level benchmarks are quite useful for answering the second. But perhaps not so much for the first.
Or maybe Crystal Diskmark is super-awesome, and FIO's not needed any more. ;)
AnnonymousCoward - Wednesday, May 11, 2016 - link
Your points look technically sound and you clearly have a far better understanding of those benchmark suites than me. The thing is, though, this is confusing. It's not obvious how to take 4 benchmark program results and know how actual computer usage precisely compares.AT got it right here: http://www.anandtech.com/print/1371/ Load times are easy to comprehend and apply to what we care about! And shockingly, RAID-0 won every suite but marginally lost in the simple use-case test.
I can tell you a lot of people have a misconception that RAID-0 SSDs or the 950 Pro load things >3% faster. [reference to the data: http://www.tomshardware.com/reviews/samsung-950-pr...] The misconception is propagated by reviews that show a bunch of graphs with big performance differences and an omission of simple use-cases. I guess users buying a NUC care about boot time, app load time, etc. Why not show the difference. That would certainly be more meaningful than any *Mark suite.
Agent Smith - Monday, May 9, 2016 - link
Not so quick to apologise eah?Experientia docet
Kvaern2 - Monday, May 9, 2016 - link
Much can be read in a username.MrSpadge - Monday, May 9, 2016 - link
"Please read the article at least once before putting forward an accusation in its comments section."Non, no! That's not how the internets are supposed to work ;)
MrSpadge - Monday, May 9, 2016 - link
(Oops, meant to reply to Ganesh's post)