GIGABYTE GB-BKi7HA-7500 Kaby Lake BRIX Review
by Ganesh T S on March 16, 2017 8:00 AM ESTPerformance Metrics - I
The GIGABYTE GB-BKi7HA-7500 was evaluated using our standard test suite for low power desktops / industrial PCs. Not all benchmarks were processed on all the machines due to updates in our testing procedures. Therefore, the list of PCs in each graph might not be the same. In the first section, we will be looking at SYSmark 2014 SE, as well as some of the Futuremark benchmarks.
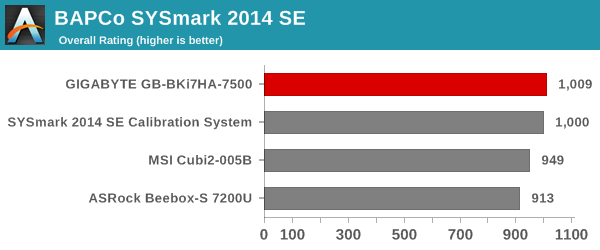
BAPCo SYSmark 2014 SE
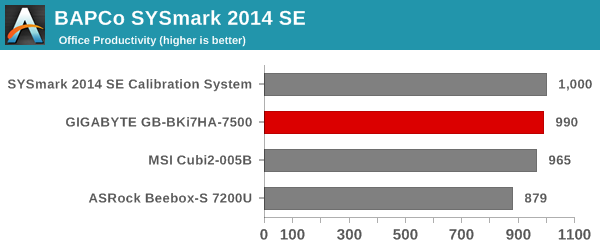
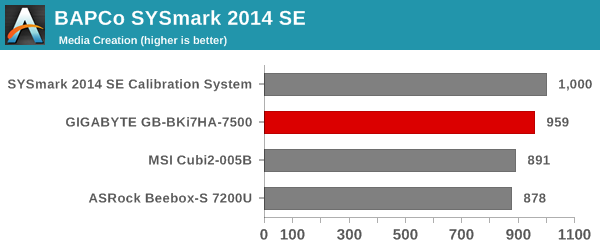
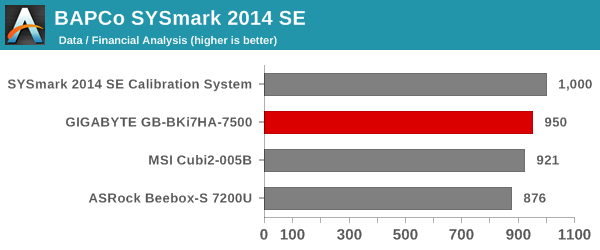
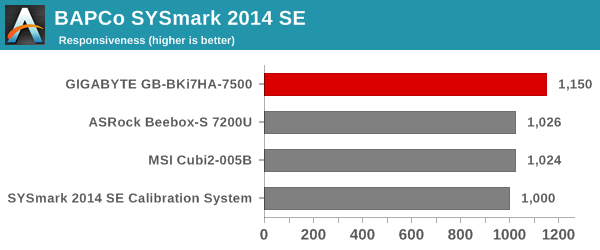
BAPCo's SYSmark 2014 SE is an application-based benchmark that uses real-world applications to replay usage patterns of business users in the areas of office productivity, media creation and data/financial analysis. In addition, it also addresses the responsiveness aspect which deals with user experience as related to application and file launches, multi-tasking etc. Scores are meant to be compared against a reference desktop (the SYSmark 2014 SE calibration system in the graphs below). While the SYSmark 2014 benchmark used a Haswell-based desktop configuration, the SYSmark 2014 SE makes the move to a Lenovo ThinkCenter M800 (Intel Core i3-6100, 4GB RAM and a 256GB SATA SSD). The calibration system scores 1000 in each of the scenarios. A score of, say, 2000, would imply that the system under test is twice as fast as the reference system.
The graphs below show that the 65W desktop CPU in the calibration system manages to outperform the 15W Core i7-7500U for all the performance-sensitive workloads. However, in the responsiveness workload, the NVMe SSD in the BRIX helps it to surpass the calibration system (equipped with a SATA SSD). The same NVMe SSD was also used in the ASRock Beebox-S 7200U. However, the Core i7 vs. Core i5 match-up makes the BRIX better on a comparative basis.
SYSmark 2014 SE also adds energy measurement to the mix. A high score in the SYSmark benchmarks might be nice to have, but, potential customers also need to determine the balance between power consumption and the efficiency of the system. For example, in the average office scenario, it might not be worth purchasing a noisy and power-hungry PC just because it ends up with a 2000 score in the SYSmark 2014 SE benchmarks. In order to provide a balanced perspective, SYSmark 2014 SE also allows vendors and decision makers to track the energy consumption during each workload. In the graphs below, we find the total energy consumed by the PC under test for a single iteration of each SYSmark 2014 SE workload and how it compares against the calibration systems.
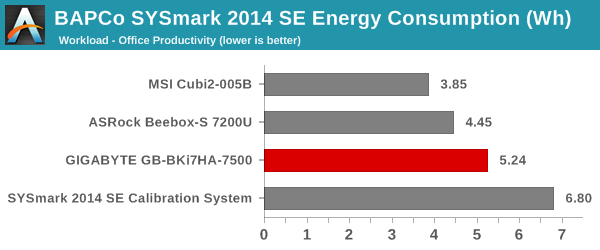
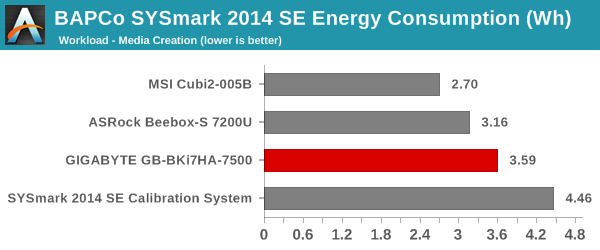
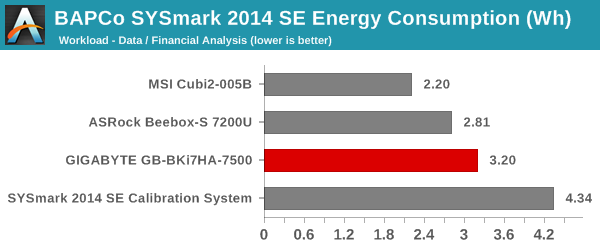
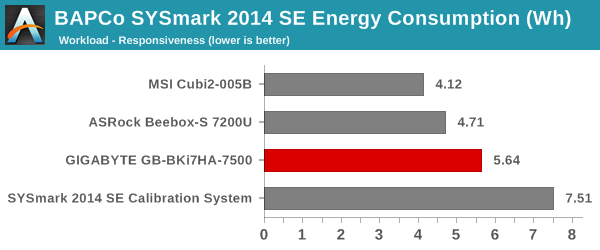
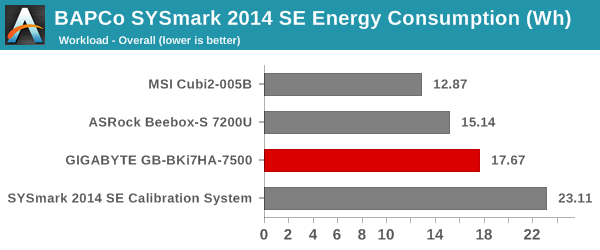
It is logical that delivering higher performance / scores usually ends up consuming more energy, and that is evident from the graphs above.
Futuremark PCMark 8
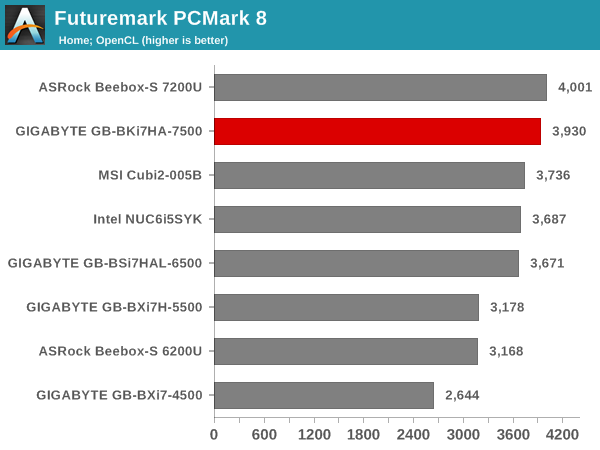
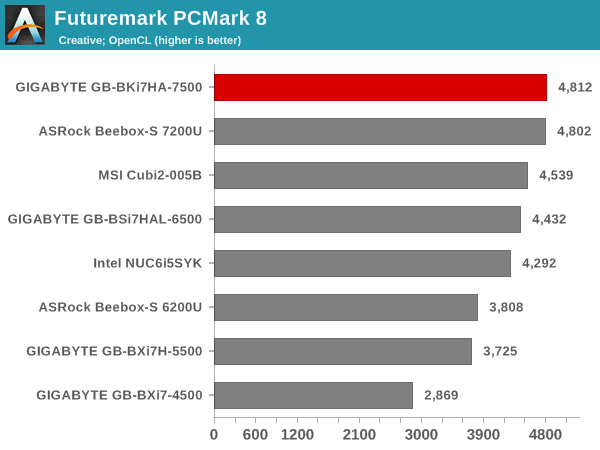
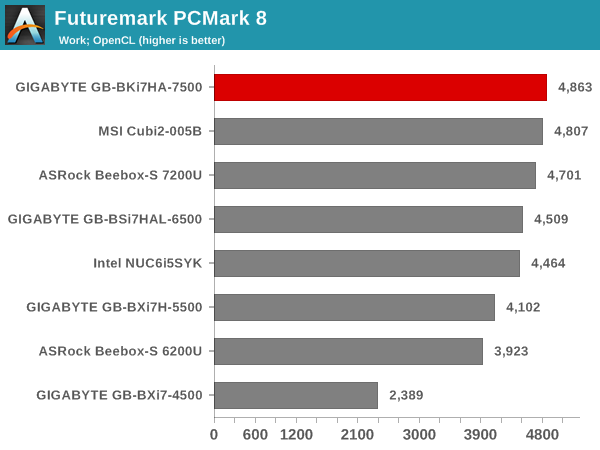
PCMark 8 provides various usage scenarios (home, creative and work) and offers ways to benchmark both baseline (CPU-only) as well as OpenCL accelerated (CPU + GPU) performance. We benchmarked select PCs for the OpenCL accelerated performance in all three usage scenarios. These scores are heavily influenced by the CPU in the system. The BRIX comes out on top in most of the workloads, but the ASRock Beebox-S 7200U performs in a similar manner.
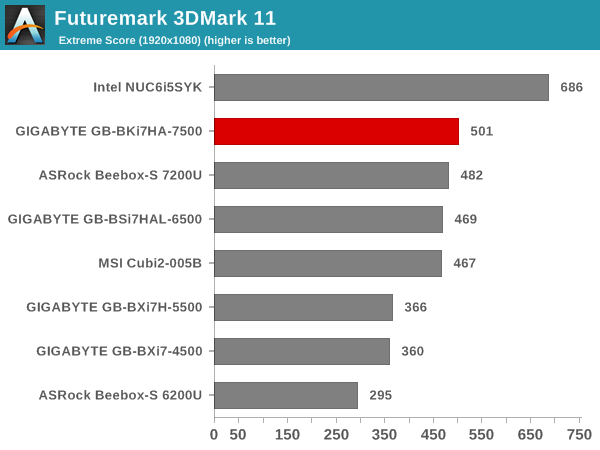
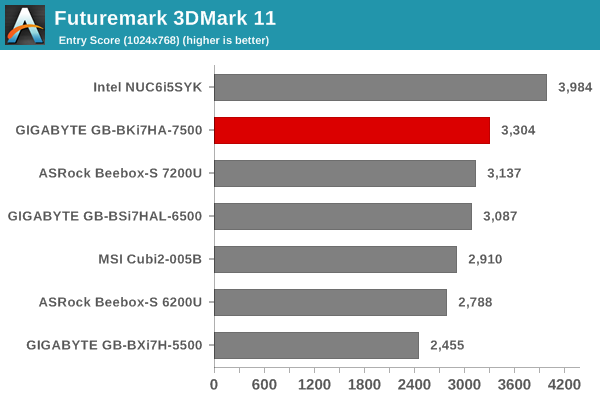
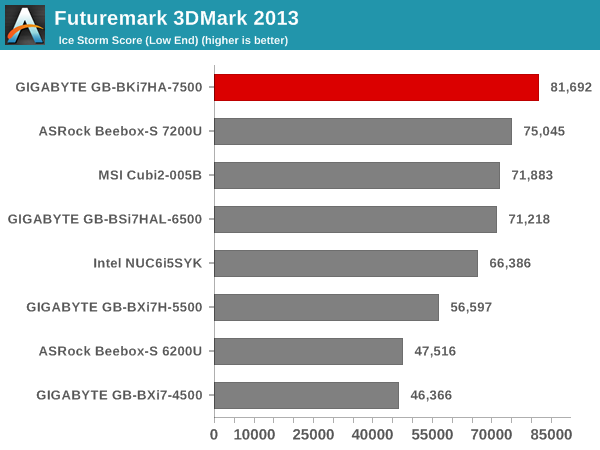
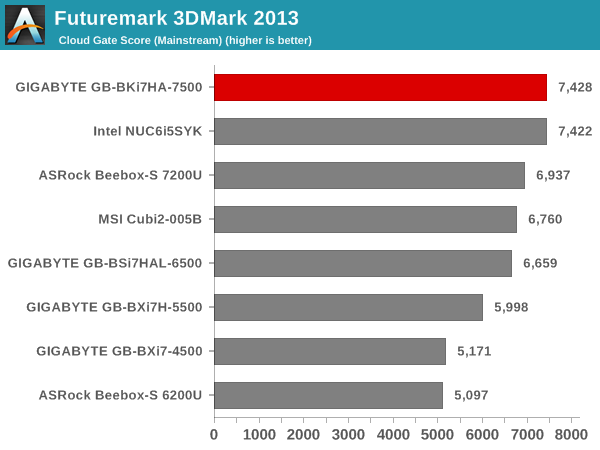
Miscellaneous Futuremark Benchmarks
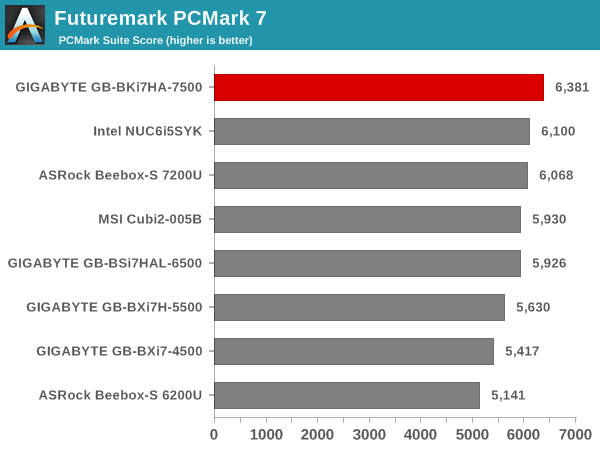
The BRIX comes with the Intel HD Graphics 620, and the configuration is the same as the other Kaby Lake UCFF PCs we have evaluated. However, the GPU workloads work in favour of the BRIX (since some aspects are CPU-limited). That said, the Iris Pro graphics engine in the Intel NUC6i5SYK performs better than the BRIX's GPU.
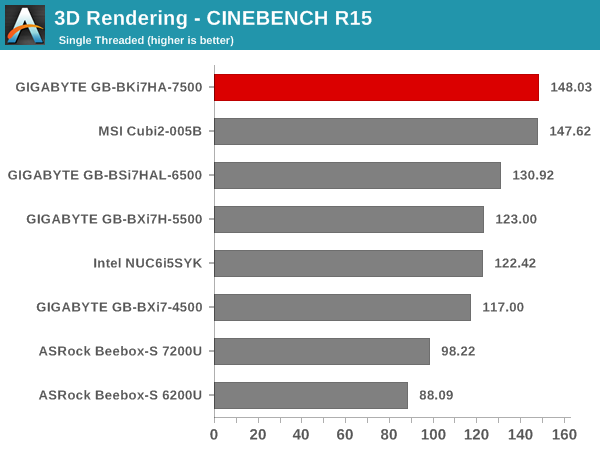
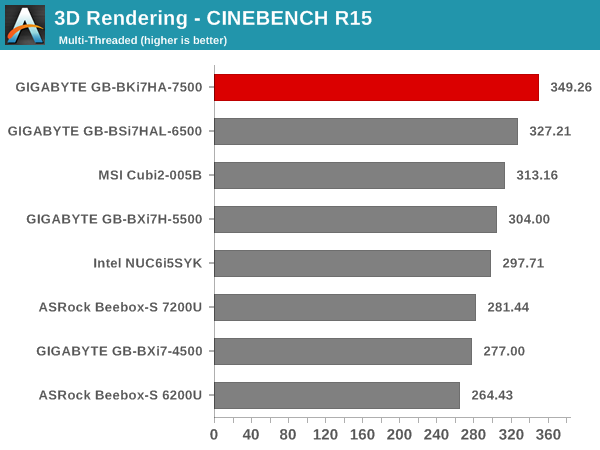
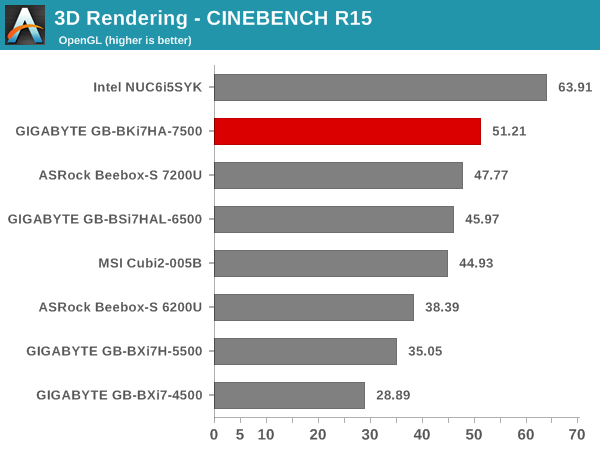
3D Rendering - CINEBENCH R15
We have moved on from R11.5 to R15 for 3D rendering evaluation. CINEBENCH R15 provides three benchmark modes - OpenGL, single threaded and multi-threaded. Evaluation of select PCs in all three modes provided us the following results. As expected, the CPU-bound benchmarks favor the BRIX. The Iris Pro-equipped NUC6i5SYK comes out on top in the OpenGL version.


32 Comments
View All Comments
peterfares - Thursday, March 16, 2017 - link
The Mac Mini is quite a bit larger than these things, that's how the power supply is integrated. That said, I do prefer the Mac Mini's form-factor more. I would take a larger box and have the power supply integrated, I've always hated external power supplies. Especially in monitors - I now only buy monitors with built in power supplies.TheinsanegamerN - Monday, March 20, 2017 - link
OTOH, external is a heck of a lot easier to replace when it goes bad. And easier to get replacements, as third parties will make externals, but not proprietary internals.capedave - Friday, March 17, 2017 - link
Power brick never bothers me, as long as it is QUALITY. Better slower quieter more powerful fans? Hell yes!geok1ng - Friday, March 17, 2017 - link
i have a hard time trying to understand the market niche for such products. they cost between a chinese 2in1 and an ultrabook, without offering many advantages over either. a SFF PC with a pentium G4560 would cost a fraction of it, while having a slightly bigger footprint. The way i see it, one either picks a performance king, like the 7267U, a budget king like the G4560, or a power sipper like the 7Y57. I fail to understand why choose a 15w SKU that does not perform when you have 3 alternatives that either cost much less, draw much less power or deliver much better graphics performance.kaidenshi - Sunday, March 19, 2017 - link
"a SFF PC with a pentium G4560 would cost a fraction of it, while having a slightly bigger footprint."Indeed, my main workstation is a Skylake G4500 and it's more than fast enough. It's in a mid tower case but I could switch to a mini-ITX board and case, keeping the rest of my components, and have something 1/4 the size with the same power. Having it in a Brix/NUC format would be even better since I don't play AAA games and have no need for a discrete GPU.
I guess we don't see Pentium Gxxxx in SFF PCs because there's really no profit margin for those CPUs.
capedave - Friday, March 17, 2017 - link
A shame that more noise analysis is not mandatory in computer reviews. From what tiny amount of information exists, I am thinking it is too loud for me. Decibels? Who knows?awehring - Friday, March 17, 2017 - link
+1no, +1000
Sailor23M - Sunday, March 19, 2017 - link
Was really looking for the comparison against the Intel Skull Canyon NUC1_rick - Saturday, April 15, 2017 - link
I suspect it doesn't compare to the Skull Canyon. No Iris and only has half the cores.DroidTomTom - Saturday, April 1, 2017 - link
The NUC market is one area where more competition is needed. Same price as a similarly equipped laptop minus monitor, speakers, web cam, keyboard, and mouse. I really hope Ryzen can make a huge dent in this area.