Intel NUC6CAYH (Arches Canyon) Apollo Lake UCFF PC Review
by Ganesh T S on January 12, 2018 8:00 AM EST- Posted in
- Systems
- Intel
- NUC
- UCFF
- Apollo Lake
- Arches Canyon
Performance Metrics - I
The Intel NUC6CAYH was evaluated using our standard test suite for low power desktops / industrial PCs. Not all benchmarks were processed on all the machines due to updates in our testing procedures. Therefore, the list of PCs in each graph might not be the same. In the first section, we will be looking at SYSmark 2014 SE, as well as some of the Futuremark benchmarks.
BAPCo SYSmark 2014 SE
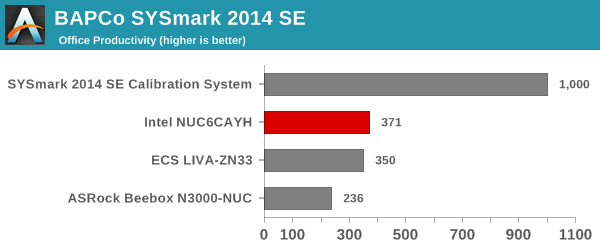
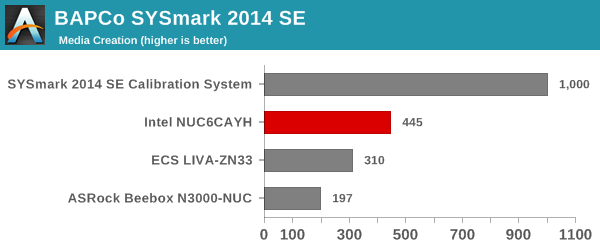
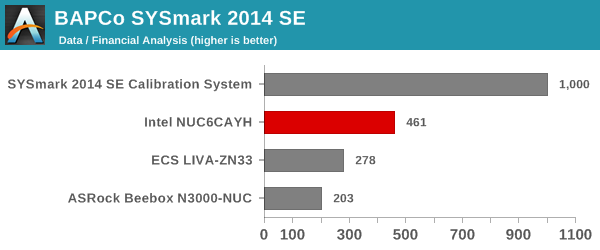
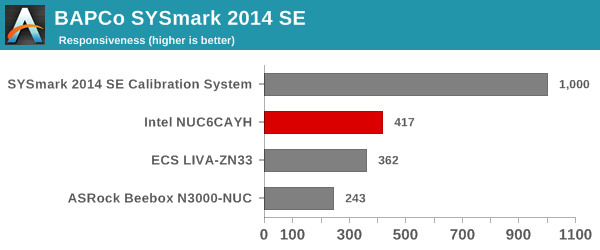
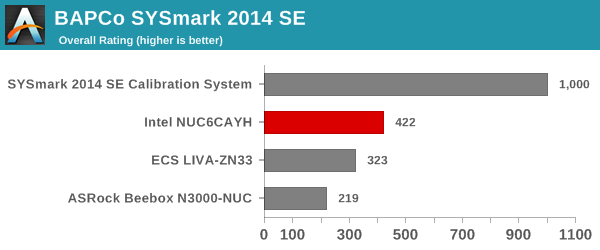
BAPCo's SYSmark 2014 SE is an application-based benchmark that uses real-world applications to replay usage patterns of business users in the areas of office productivity, media creation and data/financial analysis. In addition, it also addresses the responsiveness aspect which deals with user experience as related to application and file launches, multi-tasking etc. Scores are meant to be compared against a reference desktop (the SYSmark 2014 SE calibration system in the graphs below). While the SYSmark 2014 benchmark used a Haswell-based desktop configuration, the SYSmark 2014 SE makes the move to a Lenovo ThinkCenter M800 (Intel Core i3-6100, 4GB RAM and a 256GB SATA SSD). The calibration system scores 1000 in each of the scenarios. A score of, say, 2000, would imply that the system under test is twice as fast as the reference system.
The graphs below shows that the two extra cores and slightly higher speeds in the Celeron J3455 give the NUC6CAYH a distinct boost over the Celeron N3350 in the ECS LIVA-ZN33.
SYSmark 2014 SE also adds energy measurement to the mix. A high score in the SYSmark benchmarks might be nice to have, but, potential customers also need to determine the balance between power consumption and the efficiency of the system. For example, in the average office scenario, it might not be worth purchasing a noisy and power-hungry PC just because it ends up with a 2000 score in the SYSmark 2014 SE benchmarks. In order to provide a balanced perspective, SYSmark 2014 SE also allows vendors and decision makers to track the energy consumption during each workload. In the graphs below, we find the total energy consumed by the PC under test for a single iteration of each SYSmark 2014 SE workload and how it compares against the calibration systems.
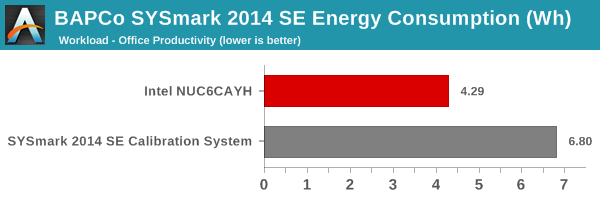
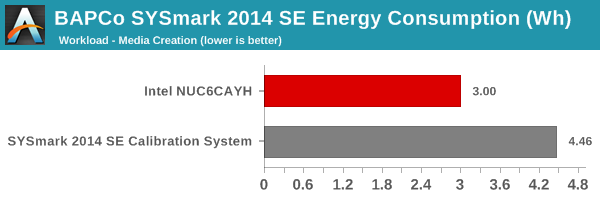

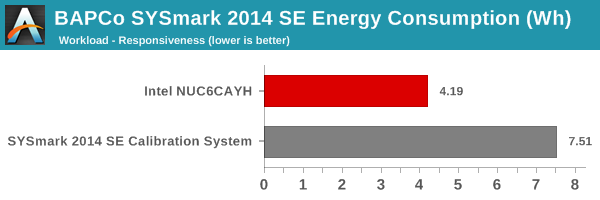
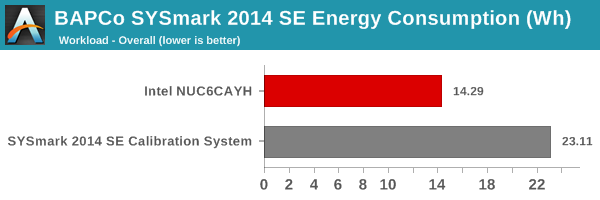
The energy numbers are no big surprise, with the calibration system utilizing a proper desktop CPU compared to the nettop variant used in the NUC6CAYH.
Futuremark PCMark 10
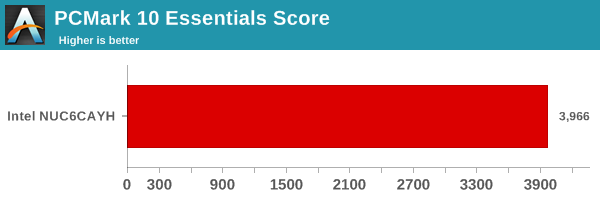
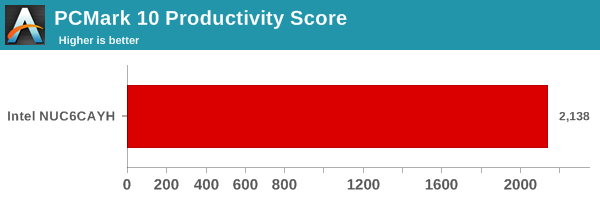
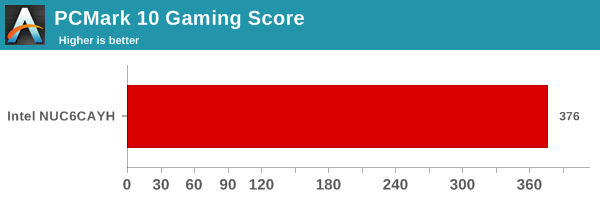
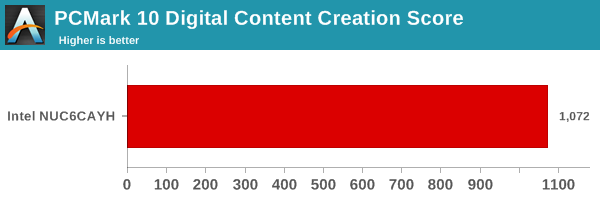
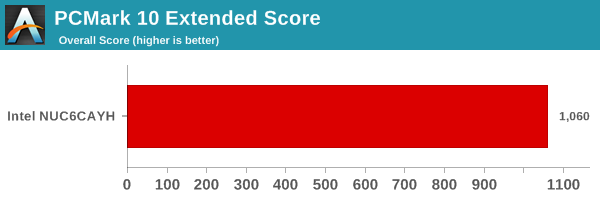
UL's PCMark 10 evaluates computing systems for various usage scenarios (generic / essential tasks such as web browsing and starting up applications, productivity tasks such as editing spreadsheets and documents, gaming, and digital content creation). We benchmarked select PCs with the PCMark 10 Extended profile and recorded the scores for various scenarios. These scores are heavily influenced by the CPU and GPU in the system, though the RAM and storage device also play a part. The power plan was set to Balanced for all the PCs while processing the PCMark 10 benchmark. We do not have PCMark 10 scores of any other Atom-class PC to compare against yet.
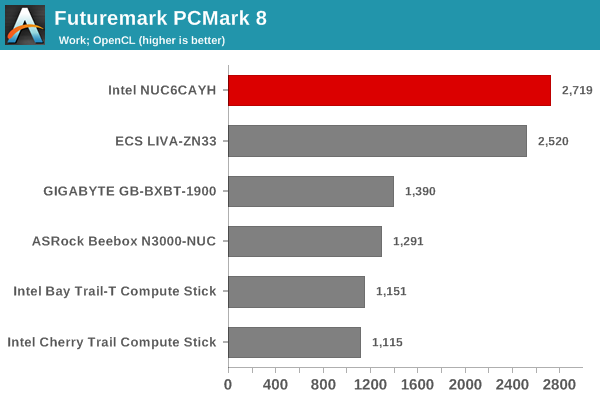
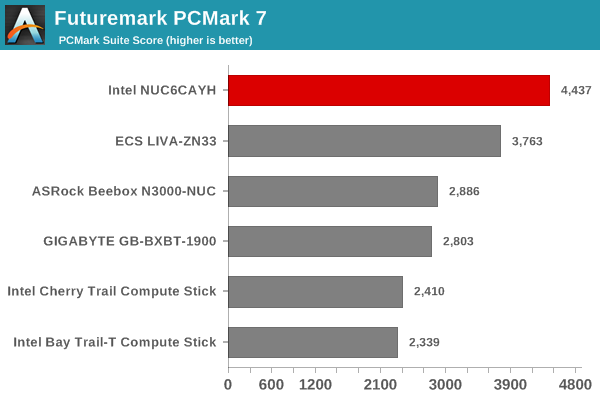
Futuremark PCMark 8
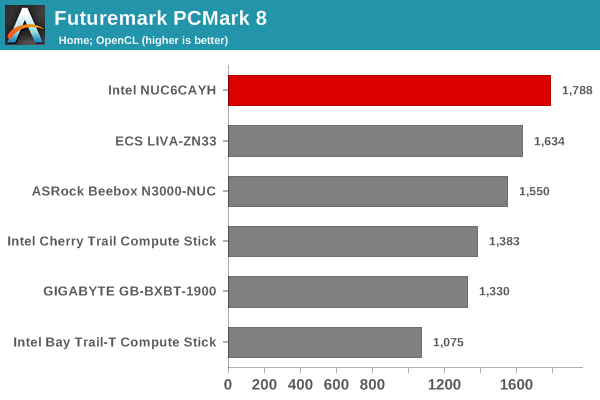
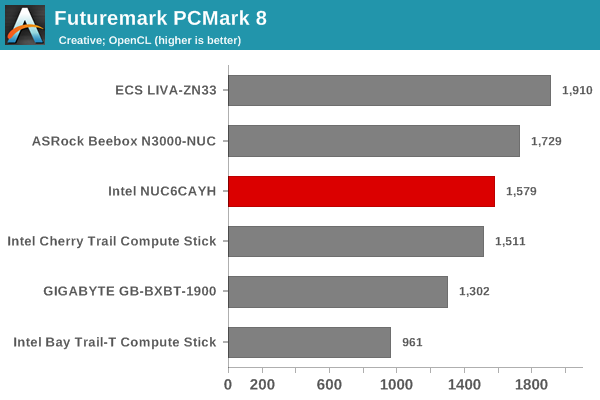
We continue to present PCMark 8 benchmark results (as those have more comparison points) while our PCMark 10 scores database for systems grows in size. PCMark 8 provides various usage scenarios (home, creative and work) and offers ways to benchmark both baseline (CPU-only) as well as OpenCL accelerated (CPU + GPU) performance. We benchmarked select PCs for the OpenCL accelerated performance in all three usage scenarios. These scores are heavily influenced by the CPU in the system. As expected, the Celeron J3455 ends up on top in almost all the benchmarks.
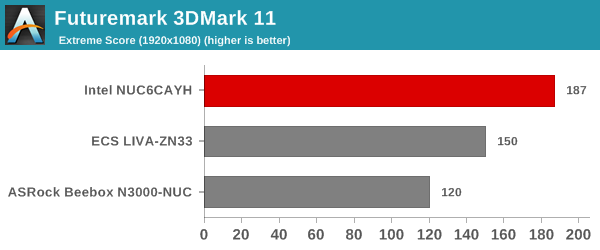
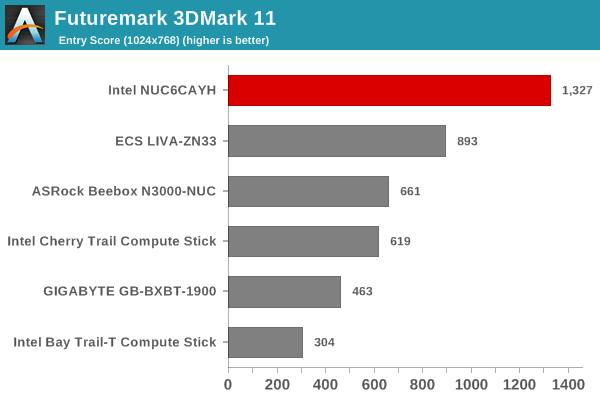
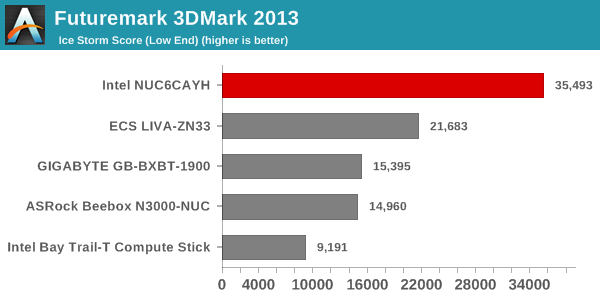
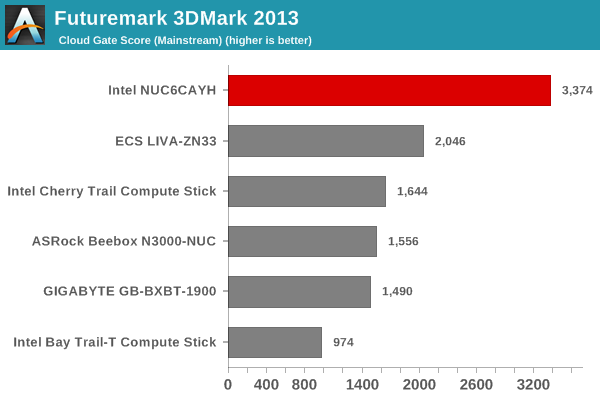
Miscellaneous Futuremark Benchmarks
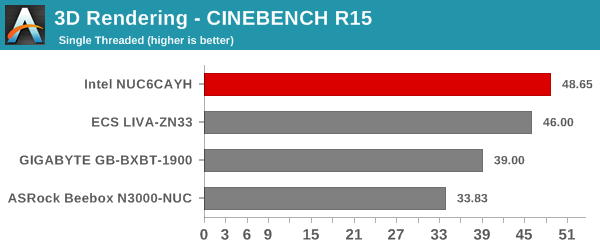
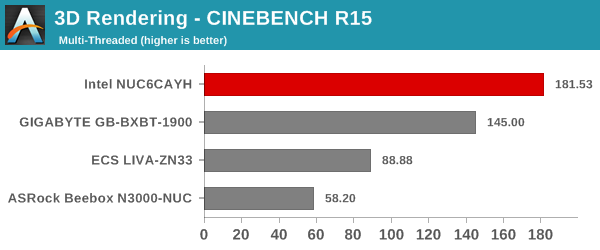
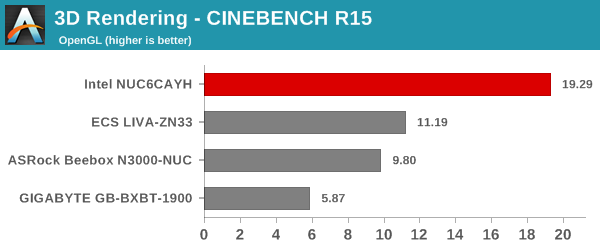
3D Rendering - CINEBENCH R15
We have moved on from R11.5 to R15 for 3D rendering evaluation. CINEBENCH R15 provides three benchmark modes - OpenGL, single threaded and multi-threaded. Evaluation of select PCs in all three modes provided us the following results. The results confirm what we found in the previous section.


54 Comments
View All Comments
Hulk - Friday, January 12, 2018 - link
Would it be possible to note the processor in the comparison systems in parenthesis for those of us who don't remember which system has which processor? Also it would be nice to have a fast processor in the metric (7700k or something like that) to get a gauge on how these low power processors compare.MattMe - Friday, January 12, 2018 - link
I agree with your points. Perhaps a U series would be a better comparison than a K series though?ganeshts - Friday, January 12, 2018 - link
I will keep that in mind for the next review.mode_13h - Monday, January 15, 2018 - link
The i3 from the BAPCo SYSmark seemed a good basis for comparison. Or maybe just the next more expensive NUC, in case someone is trying to decide whether to spend the extra money.Mr Perfect - Friday, January 12, 2018 - link
As an aside, does NUC packaging still come with the little light activated speaker that plays the Intel chime when you open the box? The first gen ones did, and I hid the speaker modules around the office so random things would chime when the light hit them. Good times...ganeshts - Friday, January 12, 2018 - link
Not in the new ones, unfortunately :)bi0logic - Friday, January 12, 2018 - link
won't this nuc be replaced by the June Canyon NUC(Gemini Lake) version any day now?intel says the NUC6CAYH launch was Q4 '16
https://ark.intel.com/products/95062/Intel-NUC-Kit...
ganeshts - Friday, January 12, 2018 - link
That is literally the last paragraph in my concluding section :)In any case, Intel plans to keep Arches Canyon in production till end of Q2 2018 as per official roadmaps.
mode_13h - Monday, January 15, 2018 - link
Still, I appreciate these benchmarks, since it should help show how much Gemini Lake (Goldmont +) actually improved.ilt24 - Friday, January 12, 2018 - link
Am I missing something? The $470 price with No OS seems quite high if the NUC starts at $130 and your just adding a pair of 4GB Memory modules and a 500GB SSD.