Samsung Galaxy S20 Ultra (Snapdragon 865) Quick Performance Preview: Impressive
by Andrei Frumusanu on March 13, 2020 6:00 AM EST- Posted in
- Mobile
- Samsung
- Smartphones
- Galaxy S20
- Galaxy S20 Ultra
GPU Performance & Power
We also finished up our GPU testing for the Galaxy S20 Ultra, and are able to showcase the Snapdragon 865’s true power efficiency as well as long-term performance for the first time.
The new Adreno 650 iGPU is a continuation of the architecture that has powered Qualcomm’s last two generations of SoCs. The company is advertising a 25% boost in performance, which we were able to verify in our performance preview of the SoC. What wasn’t very clear back then was the power efficiency of the new chip – again, our figures on the QRD865 weren’t very accurate – so testing out the new chip on an actual commercial device will be a much more representative measurement.
This is also the first time we’re able to showcase the sustained performance figures of the new generation SoC. Qualcomm had put a lot of emphasis on this aspect of the new chip, claiming it’s able to throttle a lot less than some other competing devices in the market. We hadn’t had the time to test this on the QRD865, so the S20 Ultra here will be the first device of 2020 going through this test. As a reminder, sustained performance not only is linked to the power consumption of the SoC, but also the thermal dissipation capabilities of the phone that it’s employed in, as well as the thermal limits imposed by the vendor.
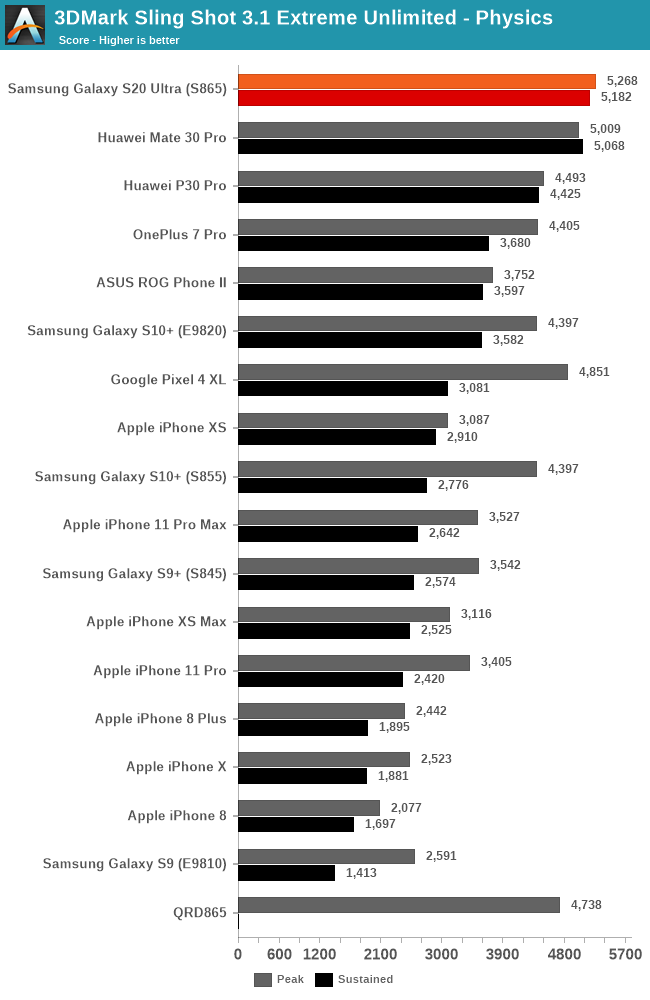
Starting off with the 3DMark Physics test, the new chip behaves fantastically, and even manages to perform better than the QRD865. The new Cortex-A77 cores are doing extremely well, and most interestingly, the sustained performance showcased by the unit is also excellent.
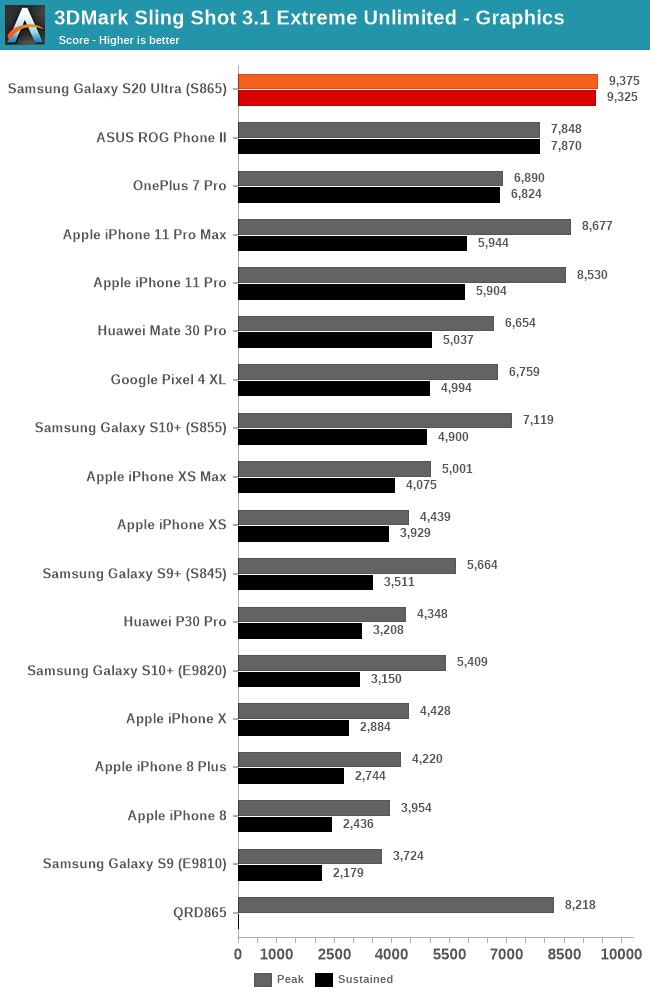
The graphics test of 3DMark is more GPU bound – and here again it showcased no throttling. This was a bit odd in the context that I did see more significant throttling in GFXBench…
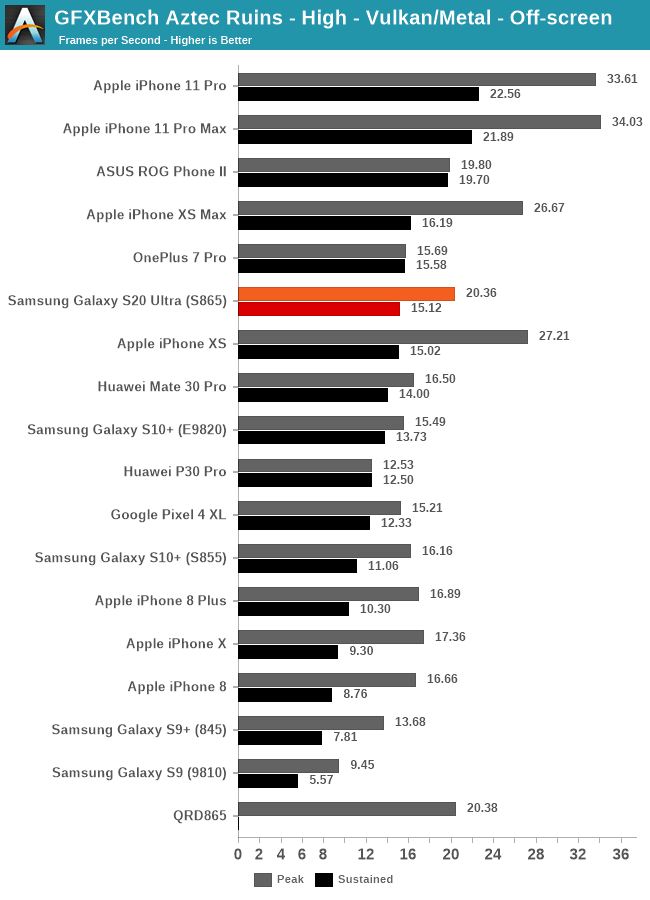
In the Aztec High test, peak performance is identical to what we’ve seen on the QRD865, and sustained performance after a while throttles down by 25%. Although it’s a good showcase, the new Galaxy S20 Ultra here doesn’t fare any better than some of the best Snapdragon 855 devices out there, as well as lagging behind Apple’s iPhones.
| GFXBench Aztec High Offscreen Power Efficiency (System Active Power) |
||||
| Mfc. Process | FPS | Avg. Power (W) |
Perf/W Efficiency |
|
| iPhone 11 Pro (A13) Warm | N7P | 26.14 | 3.83 | 6.82 fps/W |
| iPhone 11 Pro (A13) Cold / Peak | N7P | 34.00 | 6.21 | 5.47 fps/W |
| Galaxy S20 Ultra (Snapdragon 865) | N7P | 20.35 | 3.91 | 5.19 fps/W |
| iPhone XS (A12) Warm | N7 | 19.32 | 3.81 | 5.07 fps/W |
| iPhone XS (A12) Cold / Peak | N7 | 26.59 | 5.56 | 4.78 fps/W |
| Mate 30 Pro (Kirin 990 4G) | N7 | 16.50 | 3.96 | 4.16 fps/W |
| Galaxy 10+ (Snapdragon 855) | N7 | 16.17 | 4.69 | 3.44 fps/W |
| Galaxy 10+ (Exynos 9820) | 8LPP | 15.59 | 4.80 | 3.24 fps/W |
Doing power measurements on the S20U, we see quite better figures than experienced on the QRD865. Thus, the Snapdragon 865 moves up in the efficiency scoreboard, inching closer to Apple’s A-series chipsets.
What’s interesting to see here is the absolute power figure itself coming in a little under 4W. This is an excellent improvement and reduction compared to the Snapdragon 855 last year, and it means heat generation should be a lot more in check compared to previous generation flagships.
| GFXBench Aztec Normal Offscreen Power Efficiency (System Active Power) |
||||
| Mfc. Process | FPS | Avg. Power (W) |
Perf/W Efficiency |
|
| iPhone 11 Pro (A13) Warm | N7P | 73.27 | 4.07 | 18.00 fps/W |
| iPhone 11 Pro (A13) Cold / Peak | N7P | 91.62 | 6.08 | 15.06 fps/W |
| iPhone XS (A12) Warm | N7 | 55.70 | 3.88 | 14.35 fps/W |
| Galaxy S20 Ultra (Snapdragon 865) | N7P | 54.09 | 3.91 | 13.75 fps/W |
| iPhone XS (A12) Cold / Peak | N7 | 76.00 | 5.59 | 13.59 fps/W |
| Mate 30 Pro (Kirin 990 4G) | N7 | 41.68 | 4.01 | 10.39 fps/W |
| Galaxy 10+ (Snapdragon 855) | N7 | 40.63 | 4.14 | 9.81 fps/W |
| Galaxy 10+ (Exynos 9820) | 8LPP | 40.18 | 4.62 | 8.69 fps/W |
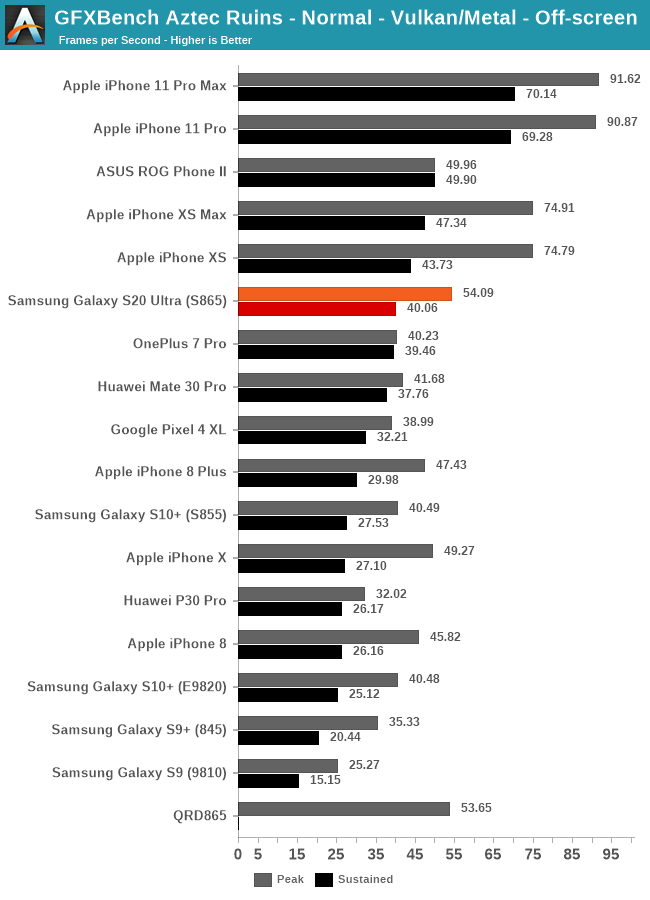
The Aztec Normal test also shows excellent absolute peak power figures, and peak performance is where it’s expected to be at. Meanwhile, throttling on the S20 Ultra is again at around -25% of peak performance for sustained scenarios.
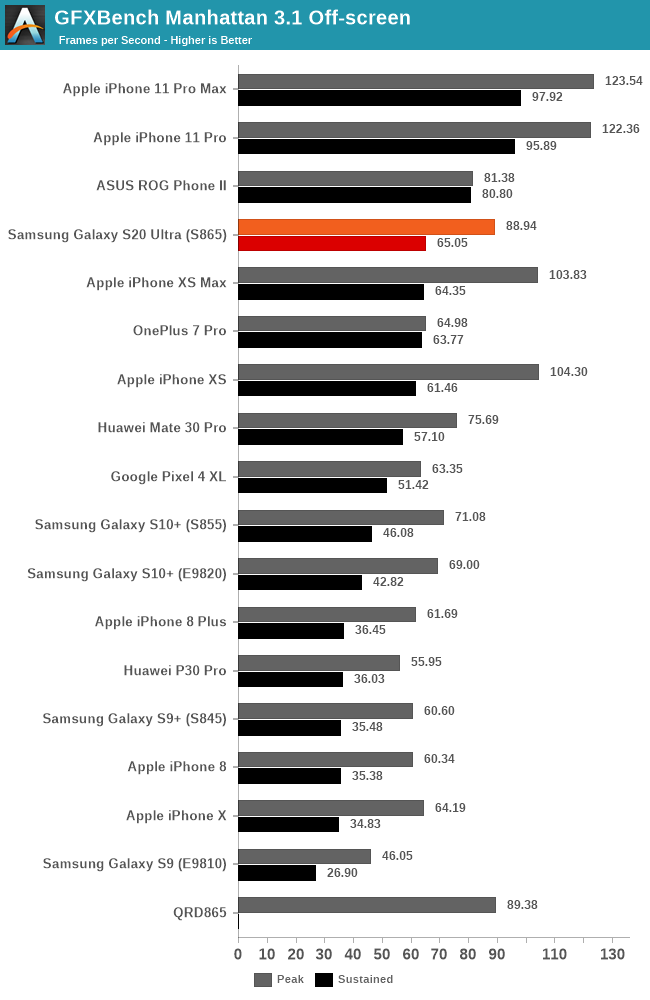
| GFXBench Manhattan 3.1 Offscreen Power Efficiency (System Active Power) |
||||
| Mfc. Process | FPS | Avg. Power (W) |
Perf/W Efficiency |
|
| iPhone 11 Pro (A13) Warm | N7P | 100.58 | 4.21 | 23.89 fps/W |
| Galaxy S20 Ultra (Snapdragon 865) | N7P | 88.93 | 4.20 | 21.15 fps/W |
| iPhone 11 Pro (A13) Cold / Peak | N7P | 123.54 | 6.04 | 20.45 fps/W |
| iPhone XS (A12) Warm | N7 | 76.51 | 3.79 | 20.18 fps/W |
| iPhone XS (A12) Cold / Peak | N7 | 103.83 | 5.98 | 17.36 fps/W |
| Mate 30 Pro (Kirin 990 4G) | N7 | 75.69 | 5.04 | 15.01 fps/W |
| Galaxy 10+ (Snapdragon 855) | N7 | 70.67 | 4.88 | 14.46 fps/W |
| Galaxy 10+ (Exynos 9820) | 8LPP | 68.87 | 5.10 | 13.48 fps/W |
| Galaxy S9+ (Snapdragon 845) | 10LPP | 61.16 | 5.01 | 11.99 fps/W |
| Mate 20 Pro (Kirin 980) | N7 | 54.54 | 4.57 | 11.93 fps/W |
| Galaxy S9 (Exynos 9810) | 10LPP | 46.04 | 4.08 | 11.28 fps/W |
| Galaxy S8 (Snapdragon 835) | 10LPE | 38.90 | 3.79 | 10.26 fps/W |
| Galaxy S8 (Exynos 8895) | 10LPE | 42.49 | 7.35 | 5.78 fps/W |
In Manhattan 3.1, things are also looking better for the Snapdragon 865. The improved power figures do have it now able to leap the A12 in power efficiency. The sustained performance comes in at 73% of peak performance in our testing conditions.
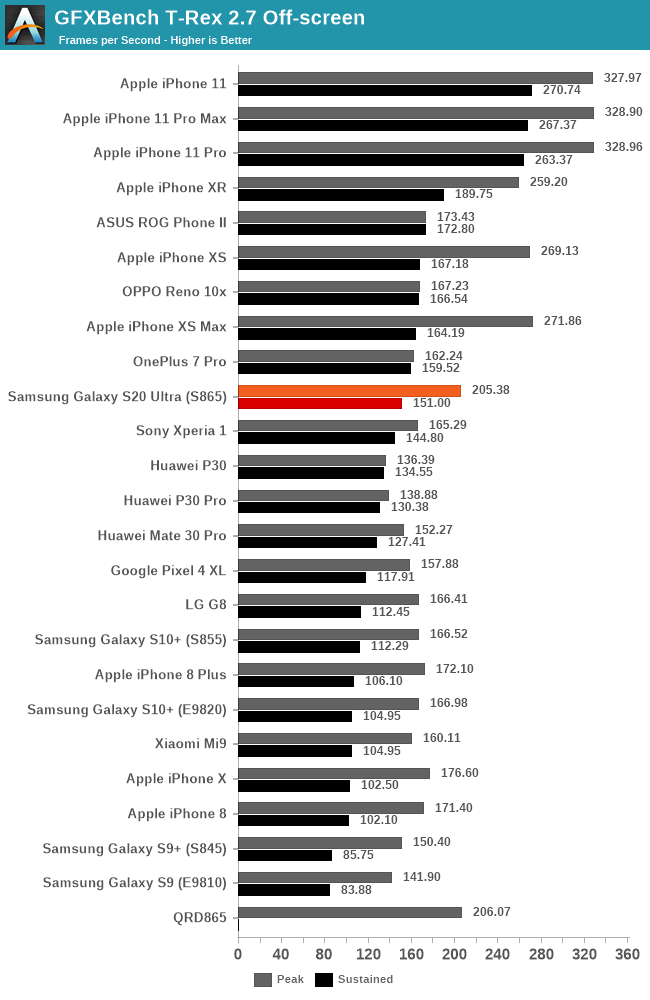
| GFXBench T-Rex Offscreen Power Efficiency (System Active Power) |
||||
| Mfc. Process | FPS | Avg. Power (W) |
Perf/W Efficiency |
|
| iPhone 11 Pro (A13) Warm | N7P | 289.03 | 4.78 | 60.46 fps/W |
| iPhone 11 Pro (A13) Cold / Peak | N7P | 328.90 | 5.93 | 55.46 fps/W |
| Galaxy S20 Ultra (Snapdragon 865) | N7P | 205.37 | 3.83 | 53.30 fps/W |
| iPhone XS (A12) Warm | N7 | 197.80 | 3.95 | 50.07 fps/W |
| iPhone XS (A12) Cold / Peak | N7 | 271.86 | 6.10 | 44.56 fps/W |
| Galaxy 10+ (Snapdragon 855) | N7 | 167.16 | 4.10 | 40.70 fps/W |
| Mate 30 Pro (Kirin 990 4G) | N7 | 152.27 | 4.34 | 35.08 fps/W |
| Galaxy S9+ (Snapdragon 845) | 10LPP | 150.40 | 4.42 | 34.00 fps/W |
| Galaxy 10+ (Exynos 9820) | 8LPP | 166.00 | 4.96 | 33.40fps/W |
| Galaxy S9 (Exynos 9810) | 10LPP | 141.91 | 4.34 | 32.67 fps/W |
| Galaxy S8 (Snapdragon 835) | 10LPE | 108.20 | 3.45 | 31.31 fps/W |
| Mate 20 Pro (Kirin 980) | N7 | 135.75 | 4.64 | 29.25 fps/W |
| Galaxy S8 (Exynos 8895) | 10LPE | 121.00 | 5.86 | 20.65 fps/W |
Finally, in T-Rex, we’re again seeing a healthy boost in efficiency compared to previous figures, but in terms of sustained performance, the S865 is still largely behind the A13 chips.
Besides the improved power efficiency numbers, we’ve now measured on the Galaxy S20 Ultra, the one thing that I really liked about the new device’s behavior is its thermal behavior. The phone wouldn’t exceed 41-42°C peak skin temperature, remaining only relatively lukewarm no matter the kind of workload you’d throw at it. This is some excellent thermal management and I appreciate this a lot more than having higher performance that leads to the phone getting uncomfortably hot. Samsung deserves some praise here.
Fantastic Performance; Stay Tuned For The Full Review
When it comes to performance, the Galaxy S20 Ultra has so far been an immensely impressive device, easily being the single fastest, most responsive, and most fluid phone I’ve had the pleasure to use, quite far ahead of any second contender. The combination of a 120Hz screen with the new Snapdragon 865 is a match made in heaven, and people prioritizing this aspect of a phone will seemingly not be disappointed in the S20 line-up.
There’s still a lot of work to do until we get the full review finished, notably still waiting on the Exynos variants of the devices. One aspect that I want to make note of right now is that there’s been some concerns in regards to the battery life aspect of the new 120Hz mode of the phones, and I can confirm that in this setting the S20 Ultra showcases worse battery life than the S10+ (-10% in our web test), even though the new unit has a more efficient SoC as well as a 21% bigger battery. Samsung’s implementation of the 120Hz mode comes at quite a large power hit that’s very disappointing in how it behaves, and the device in general seems not quite as efficient even at 60Hz.
I’ll be posting a separate battery preview once I get more battery testing numbers together, and of course we’ll have a full feature review out once all the thorough testing is completed.


117 Comments
View All Comments
id4andrei - Sunday, March 15, 2020 - link
I've read it. 3dmark is all about thermals and Snapdragon is thermally more sustainable.iphonebestgamephone - Monday, March 16, 2020 - link
Then why does the kirin 990 score higher than sd855+? Better heatpipes on the mate 30 pro?name99 - Monday, March 16, 2020 - link
If you're not even interested in the difference between 3DMark PHYSICS and 3DMark then you don't have anything technical to contribute to this discussion.The PHYSICS benchmark has very different characteristics from the rest. If you want to use it as a tool to understand SoCs, you ought to start by appreciating that point.
name99 - Monday, March 16, 2020 - link
It's not a cheering match!I'm trying to explain the characteristic of the benchmark. That's a technical statement, it has nothing to do with who prefers what company. It's no different from pointing out that a benchmark like Lua is going to stress indirect branches, or that mcf depends strongly on memory latency.
Look at the historical values of 3DMark Physics across a wide variety of devices (Apple or otherwise). Obsessing/cheering over whether the iPhone Pro Max is throttling or not blinds you to the larger issues of how the benchmark behaves generically.
id4andrei - Monday, March 16, 2020 - link
I was not talking about physics only. The GPU version of 3dmark is the same. Check out the sustained numbers and note how the delta is so much higher on the iphone.Spec on this site is ran on an active cooled setup. Otherwise no phone, android or ios, can run it without throttling massively or crashing. In this aspect the 3dmark test is a more realistic, phone in hand scenario.
iphonebestgamephone - Tuesday, March 17, 2020 - link
You were replying to a comment which specifically mentioned the phyiscs test. Why is sd worse than the kirin?doungmli - Saturday, March 14, 2020 - link
Or do you see that? I see in:physics:
s9 (2591/1513)
Note 9 (2659/2227)
Graphics:
s9 (3724/2179)
Note 9 (3832/3639)
The performances are very close, for the second values it is normal it is about sustained performance which therefore depends by thermal.
same for the iphone.
Physics:
11 pro max (3527/2642)
XS (3087/2910)
Graphics:
11 pro max (8677/5944)
XS (4439/3929).
Scores are consistent
jaju123 - Friday, March 13, 2020 - link
Any preliminary thoughts on Exynos 990 vs. SD865? Being in Europe it's always one of the main considerations with these devices. I'm not hearing good things about the battery on the Exynos 990 ones at all.Andrei Frumusanu - Friday, March 13, 2020 - link
I'm not getting the 990 till tomorrow or Monday, not much to say at this point.Luckky26 - Tuesday, April 7, 2020 - link
Even the snapdragon 865 is expected to show some issues due to a non-integrated 5G modem which apparently takes up more space