The Corsair MP400 1TB QLC NVMe SSD: A Quick Review
by Billy Tallis on December 11, 2020 2:00 PM ESTWhole-Drive Fill
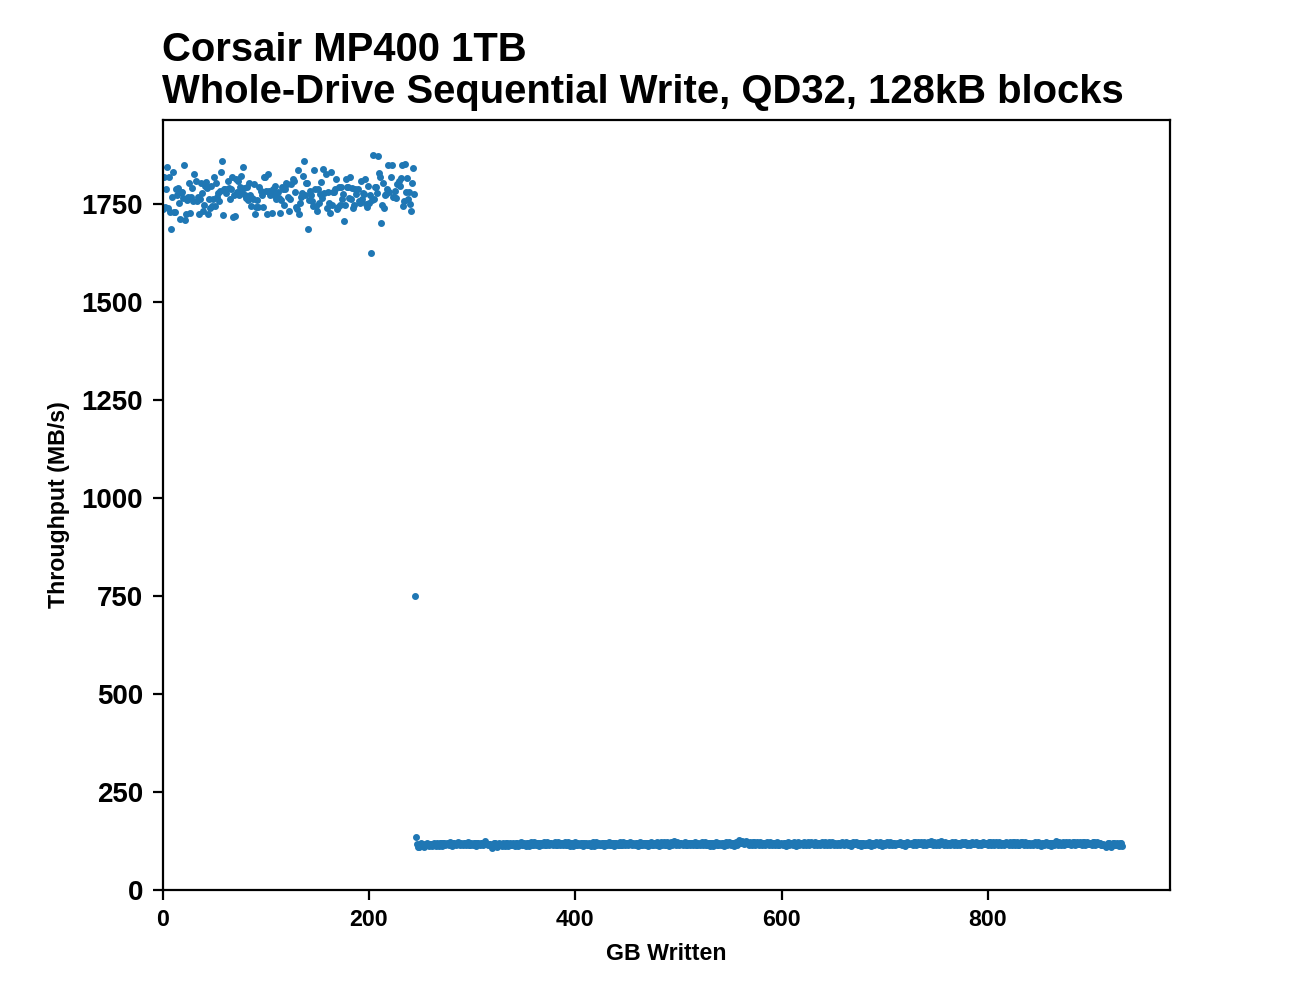
This test starts with a freshly-erased drive and fills it with 128kB sequential writes at queue depth 32, recording the write speed for each 1GB segment. This test is not representative of any ordinary client/consumer usage pattern, but it does allow us to observe transitions in the drive's behavior as it fills up. This can allow us to estimate the size of any SLC write cache, and get a sense for how much performance remains on the rare occasions where real-world usage keeps writing data after filling the cache.
 |
|||||||||
The Corsair MP400 opts for the largest possible SLC cache size, allowing for a quarter of the drive's advertised capacity to be written to the cache before performance plummets. This is the same strategy used by the Sabrent Rocket Q and probably all other QLC drives using Phison controllers. The Intel and Crucial QLC drives based on Silicon Motion's SM2263 controller have somewhat smaller variable-sized SLC caches, while the Samsung QLC SATA drives use the same small SLC cache sizes as their TLC counterparts.
 |
|||||||||
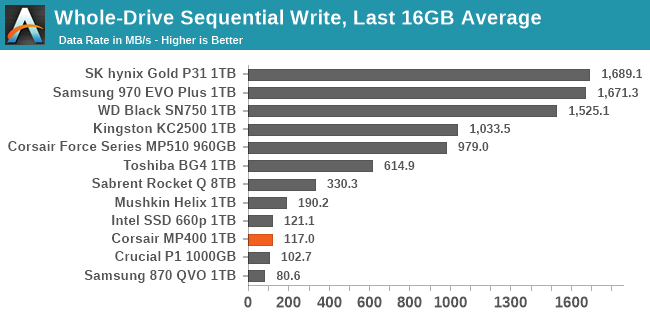
| Average Throughput for last 16 GB | Overall Average Throughput | ||||||||
Overall drive fill performance for the Corsair MP400 is marginally faster than for the other 1TB QLC drives we've tested, but the DRAMless TLC drives and the larger Sabrent Rocket Q are considerably faster. However, all of the budget NVMe drives are clearly much slower for sustained writes than the mainstream and high-end TLC drives.
Working Set Size
 |
|||||||||
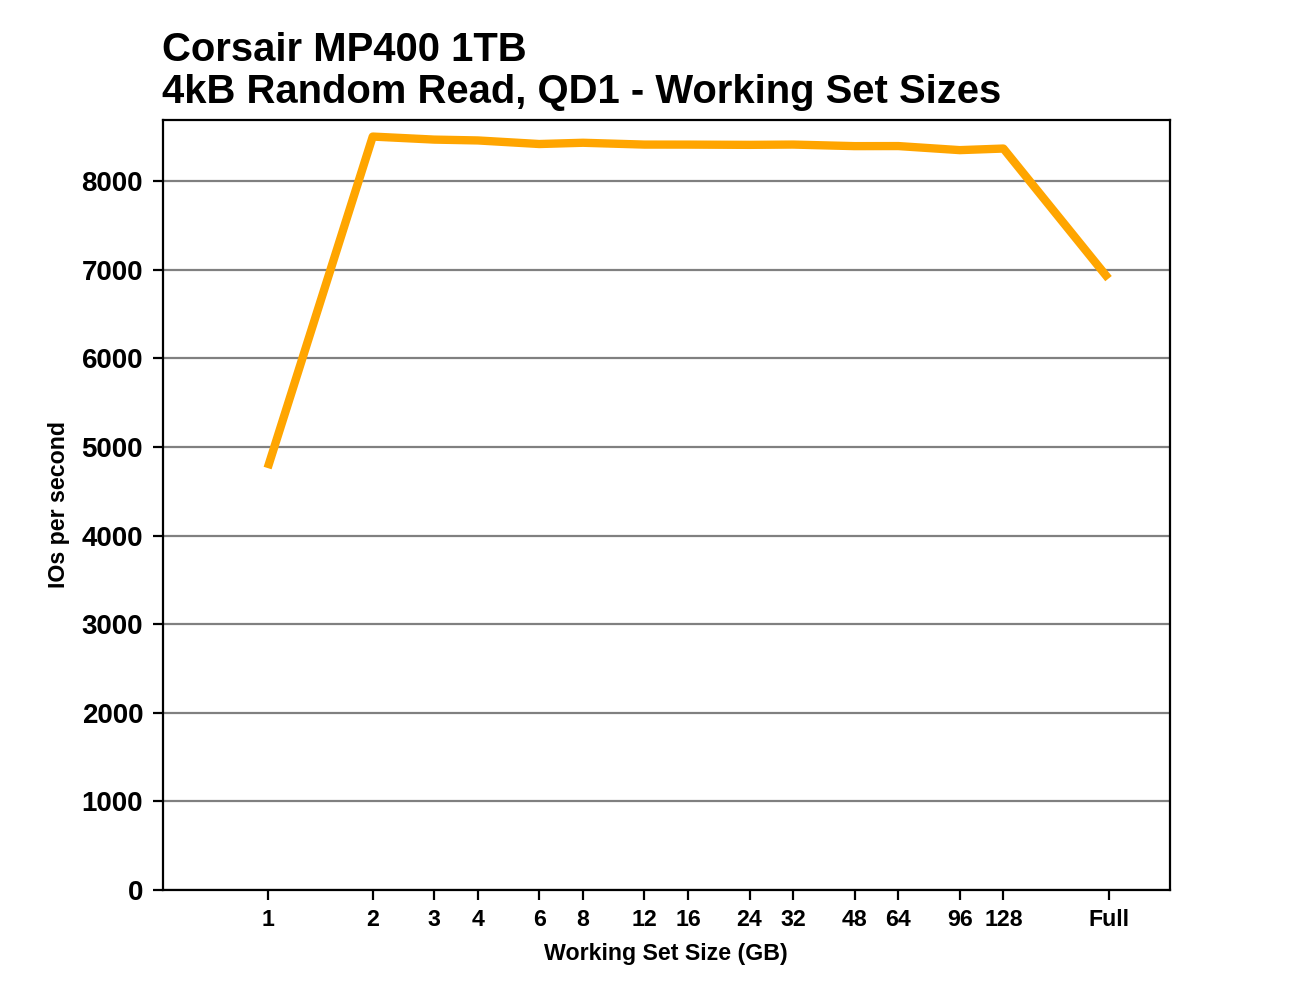
The random read latency from the Corsair MP400 is quite similar to what we saw from the 8TB Sabrent Rocket Q, especially for medium to large working sets. The 1TB MP400 doesn't exhibit the same unsteady performance for small working sets as the 8TB Rocket Q, but instead only shows poor performance for the absolute smallest working set size tested.
The performance drop-off when performing random reads across the entire drive is expected and normal, because the Crucial P1 is the only QLC drive in this bunch to include the full 1GB per 1TB of DRAM. Most low-end DRAMless TLC drives will show an even earlier drop in performance, and many of the more mainstream TLC drives that have switched to a lower DRAM ratio will also show the same drop that the Rocket Q and MP400 show.


75 Comments
View All Comments
Spunjji - Monday, December 14, 2020 - link
Yes, the drive is absolutely fine for its intended use case and completely inappropriate when used in ways which were not intended (and where its performance would be miserable anyway). 🥱In terms of my usage, for example, it's less "almost disposable" and more "extremely unlikely to wear out before it becomes useless in what will be my current system 10-15 years from now".
zdz - Friday, December 11, 2020 - link
Don't need to look at Samsung. Corsair MP500 1 TB (previous generation model) had 1700 TBW. Eight times more. Today's drive are becoming creap.zdz - Friday, December 11, 2020 - link
I meant mp510, sorry.Makaveli - Saturday, December 12, 2020 - link
Yup the Corsair MP600 1TB which is based on the E16 controller is rated for 1800TBW.Maverick009 - Friday, December 11, 2020 - link
You are talking about 2 similarly but differently marketed drives, the Samsung 860 EVO is a step up or step down from QLC drives depending on how you look at it. The actual 200TBW or 600TBW is based slightly on warranty, data written to drive, along with a few other metrics, but in majority of cases an SSDs life will last several years to decades before it gives out. Well past the purchase date and in some cases past your lifetime.GeoffreyA - Saturday, December 12, 2020 - link
Using Kristian's 850 Evo calculations as a guide, I got the following values, assuming a 1,000 p/e cycle for QLC on a 1 TB drive:20 GB/day (with 1.5x write amp) == 93.52 years
50 GB/day (1.5x w.a.) == 37.4 y
100 GB/day (3x w.a.) == 9.35 y
Hopefully, I didn't muck it all up :)
Spunjji - Monday, December 14, 2020 - link
Nice! Looks like it would be perfectly suitable for the lower-end users that QLC drives are aimed at.But hey, number go down, so all the NAND ranters have a sad.
GeoffreyA - Tuesday, December 15, 2020 - link
I'm sure the Fact Rewriting Squad can work wonders with those values ;)joesiv - Monday, December 14, 2020 - link
Good idea using P/E cycles.Just remember, OS writes != NAND writes.
There are other factors that will increase the WAF (Write Amplification Factor).
It's totally not uncommon to have a WAF of 2x, but if there are bugs, or firmwares too focused on speed or particular usage scenarios, the WAF can be much much higher.
Basically, it needs to be tested.
SMART data may provide this for you, look at your Average Nand writes.
If you're at 10, then you're 1/100th through your 1000 P/E cycles. You can calculate out how many GB/TB's you've used by using the life expecancy the manufactuers advertise (200TB?), divided by that ratio, to find actual NAND writes (if the SMART CTL isn't giving it to you)
Good luck!
GeoffreyA - Tuesday, December 15, 2020 - link
Had a crack at this earlier. Attributes were a bit obscure, but after some research, took value 241, LBAs written, and multiplied by 512 to work out bytes. From there, got about 2.28 TB or so, which squares with the ~2.4 TB value in Hwinfo. It's an 860 Evo 500 GB, just over a year old. I hardly play games or anything any more, so that's why the writes are so low. Also, round about May, put in a mechanical drive that was just collecting dust. It works well for storing films. Before that, space was a battle on the SSD.