The Mac Pro Review (Late 2013)
by Anand Lal Shimpi on December 31, 2013 3:18 PM ESTSetting Expectations: A Preview of What's to Come in Mobile
Sitting in the audience at the iPhone 5s launch I remember seeing this graph showing iPhone CPU performance increase since the first iPhone. Apple claimed a 41x increase in CPU performance if you compared the Cyclone cores in its A7 SoC to the ARM11 core in the first iPhone. What’s insane is just how short of a time period that comparison spans: 2007 - 2013.
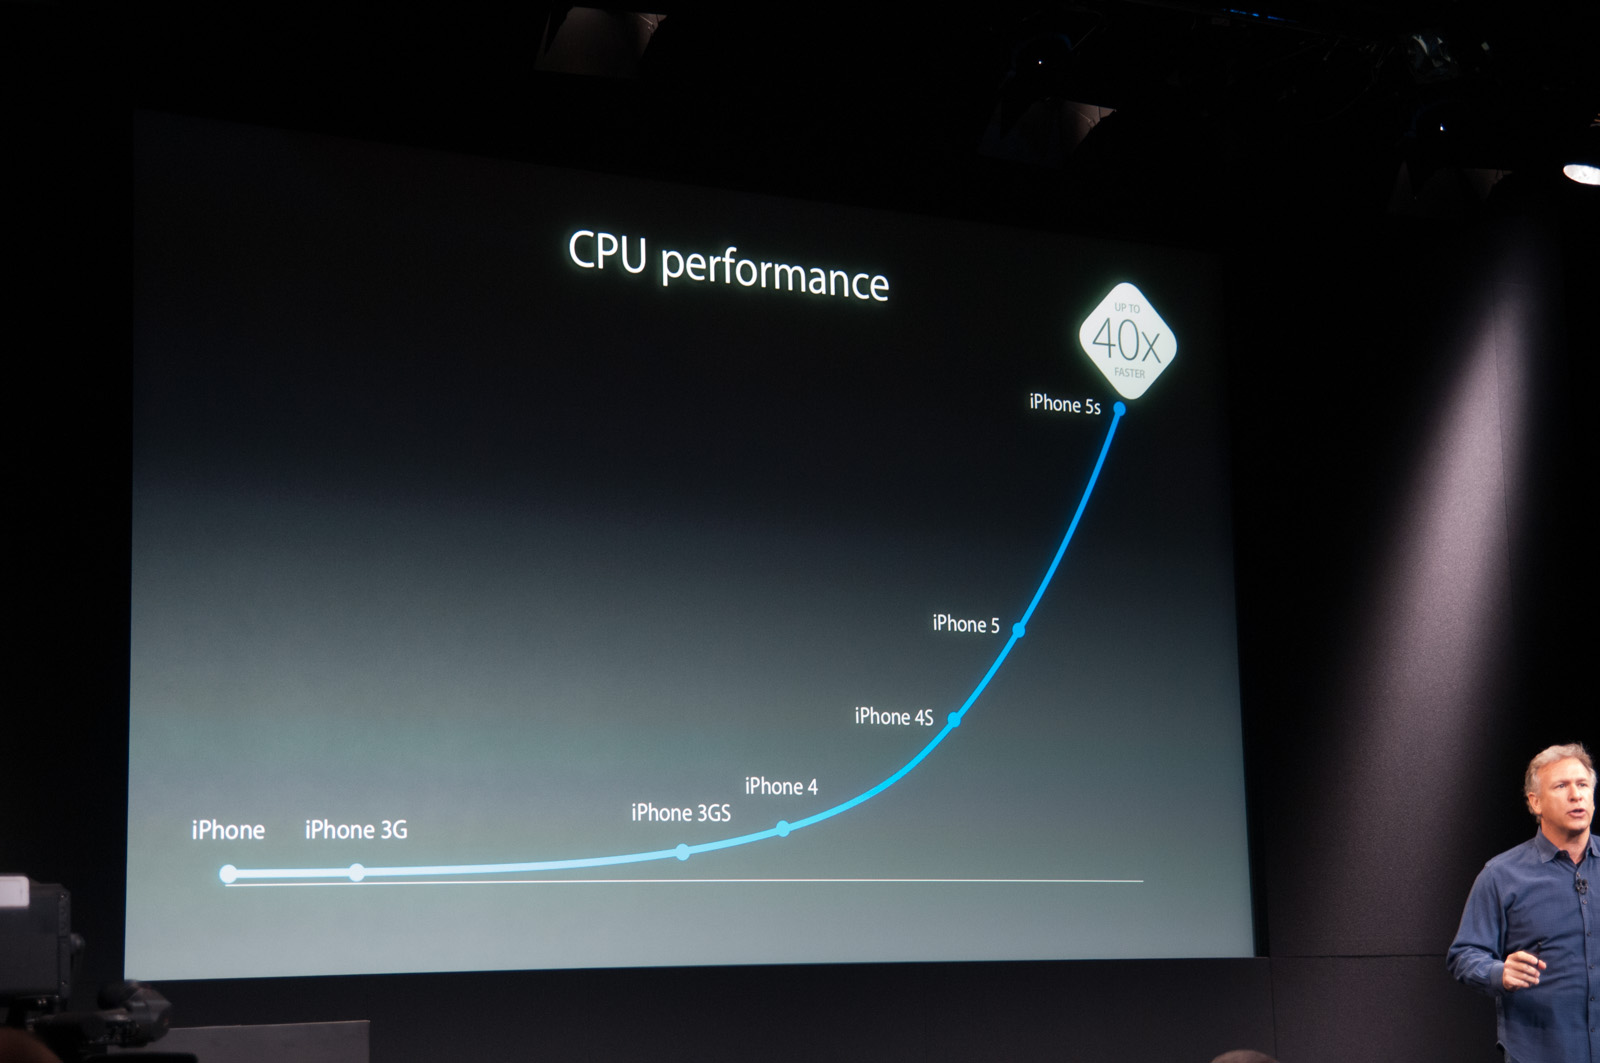
I ran SunSpider on all of the iPhones in our 5s review to validate Apple’s numbers. I came out with roughly a 100x increase in performance, or something closer to half of that if you could run later versions of iOS (with Safari/js perf improvements). SunSpider is a very CPU and browser bound workload, but even if we turn to something a bit closer to real world usage like Browsermark 2.0 I measured a 5x increase in CPU performance over the past 6 years of iPhones.
I frequently refer to the progress we’ve seen in mobile as being hyper-moore’s-law. Until recently, the gains in mobile hadn’t yet approached a point where they were limited by process technology. Instead it’s variables like cost or time to market that govern how much performance was delivered each year. We’re at the beginnings of all of this changing, and it’ll eventually look a lot like what we’ve had in the desktop and mobile CPU space for years now.
When performance results from the new Mac Pro first hit, there seemed to be disappointment in how small some of the gains were. If you compare it to the progress in CPU performance Apple has demonstrated on the other side of the fence, you’re bound to be underwhelmed.
Having personally reviewed every CPU architecture that has gone into the Mac Pro since its launch, I had a rough idea of what to expect from each generation - so I decided to put it all in a chart.
I went back through all of my Conroe, Penryn, Nehalem, Westmere and Ivy Bridge data, looked at IPC improvement in video encoding/3D rendering workloads and used it to come up with the charts below. I made a table of every CPU offered in the Mac Pro, and scaled expected performance according to max single and multicore turbo.
Let’s first start by looking at what you can expect if you always buy the absolute cheapest Mac Pro. That means starting off with the Xeon 5130, moving to the E5462, then the W3520, W3530, W3565 and ending up with the E5-1620 v2 in today’s Mac Pro. I’ve put all of the choices in the table below:
| Mac Pro - Cheapest Configuration Upgrade Path | ||||||||||
| CPU | Chips | Cores per Chip | Total Cores / Threads | Clock Base/1CT/MaxCT | Launch Price | |||||
| Mid 2006 | Xeon 5130 | 2 | 2 | 4 / 4 | 2.0/2.0/2.0 GHz | $2199 | ||||
| Early 2008 | Xeon E5462 | 1 | 4 | 4 / 4 | 2.8/2.8/2.8 GHz | $2299 | ||||
| Early 2009 | Xeon W3520 | 1 | 4 | 4 / 8 | 2.66/2.93/2.8 GHz | $2499 | ||||
| Mid 2010 | Xeon W3530 | 1 | 4 | 4 / 8 | 2.8/3.06/2.93 GHz | $2499 | ||||
| Mid 2012 | Xeon W3565 | 1 | 4 | 4 / 8 | 3.2/3.46/3.33 GHz | $2499 | ||||
| Late 2013 | Xeon E5-1620 v2 | 1 | 4 | 4 / 8 | 3.7/3.9/3.7GHz | $2999 | ||||
If you always bought the cheapest Mac Pro CPU offering, this is what your performance curve in both single and multithreaded workloads would look like:
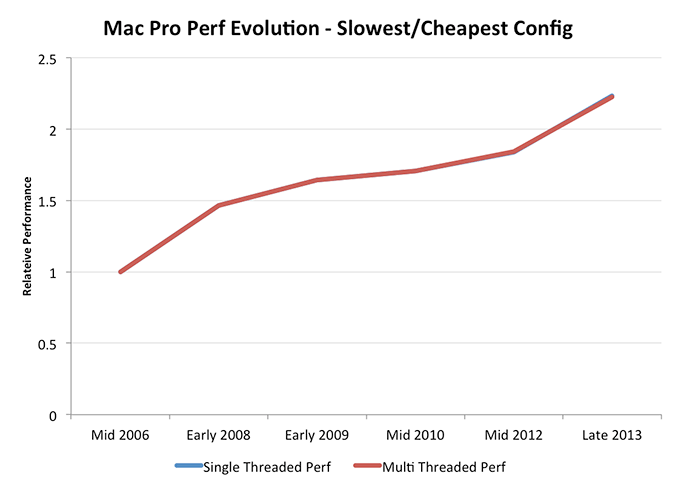
The first thing that stands out is both workloads follow roughly the same curve. The entry-level Mac Pro has always been a quad-core option, so you get no increased MT scaling (if you exclude the initial Nehalem bump from enabling Hyper Threading, which all subsequent Mac Pros have supported).
If you’ve always bought the slowest Mac Pro you’ll end up with a Mac Pro today that’s roughly 2.2x the performance of the very first Mac Pro. It’s a substantial increase in performance, but definitely not the sort of gains we’ve seen in mobile. For anyone who has been following the x86 CPU evolution over the past decade, this shouldn’t come as a surprise. There are huge power tradeoffs associated with aggressively scaling single threaded performance. Instead what you see at the core level is a handful of conservatively selected improvements. Intel requires that any new microarchitectural feature introduced has to increase performance by 2% for every 1% increase in power consumption. The result is the end of unabated increase in single threaded performance. The gains you see in the curve above are more or less as good as they get. I should point out that this obviously ignores the ~10% IPC gains offered by Haswell (since we don’t yet have a Haswell-EP). It’s also worth noting that Intel presently delivers the best single threaded performance in the industry. Compared to AMD alone you’re looking at somewhere around a 40% advantage, and ARM doesn’t yet offer anything that competes at these performance levels. It’s bound to be harder to deliver big gains when you’re at this performance level.
Back to the curve at hand, the increase in performance the 2013 Mac Pro offers is arguably one of the best upgrades over the life of the system - assuming you always opted for the entry level quad-core configuration.
What if you always did the opposite though and picked the highest-end CPU configuration? Same deal as before, I’ve documented the upgrade path in the table below:
| Mac Pro - Most Expensive Configuration Upgrade Path | ||||||||||
| CPU | Chips | Cores per Chip | Total Cores / Threads | Clock Base/1CT/MaxCT | Launch Price | |||||
| Mid 2006 | Xeon X5365 | 2 | 4 | 8 / 8 | 3.0/3.0/3.0 GHz | $3999 | ||||
| Early 2008 | Xeon X5482 | 2 | 4 | 8 / 8 | 3.2/3.2/3.2 GHz | $4399 | ||||
| Early 2009 | Xeon X5570 | 2 | 4 | 8 / 16 | 2.93/3.33/3.06 GHz | $5899 | ||||
| Mid 2010 | Xeon X5670 | 2 | 6 | 12 / 24 | 2.93/3.33/3.06 GHz | $6199 | ||||
| Mid 2012 | Xeon X5675 | 2 | 6 | 12 / 24 | 3.06/3.46/3.2 GHz | $6199 | ||||
| Late 2013 | Xeon E5-2697 v2 | 1 | 12 | 12 / 24 | 2.7/3.5/3.0 GHz | $6999 | ||||
Now things start to get interesting. For starters, single and multithreaded performance scaling is divergent. The high-end CPU option started as two quad-core CPUs but after three generations moved to a total of twelve cores. What this means is that after the early 2009 model you see a pretty significant increase in multithreaded performance for the fastest Mac Pro configuration. Scaling since then has been comparatively moderate as you’re looking at IPC and frequency improvements mostly with no change in core count.
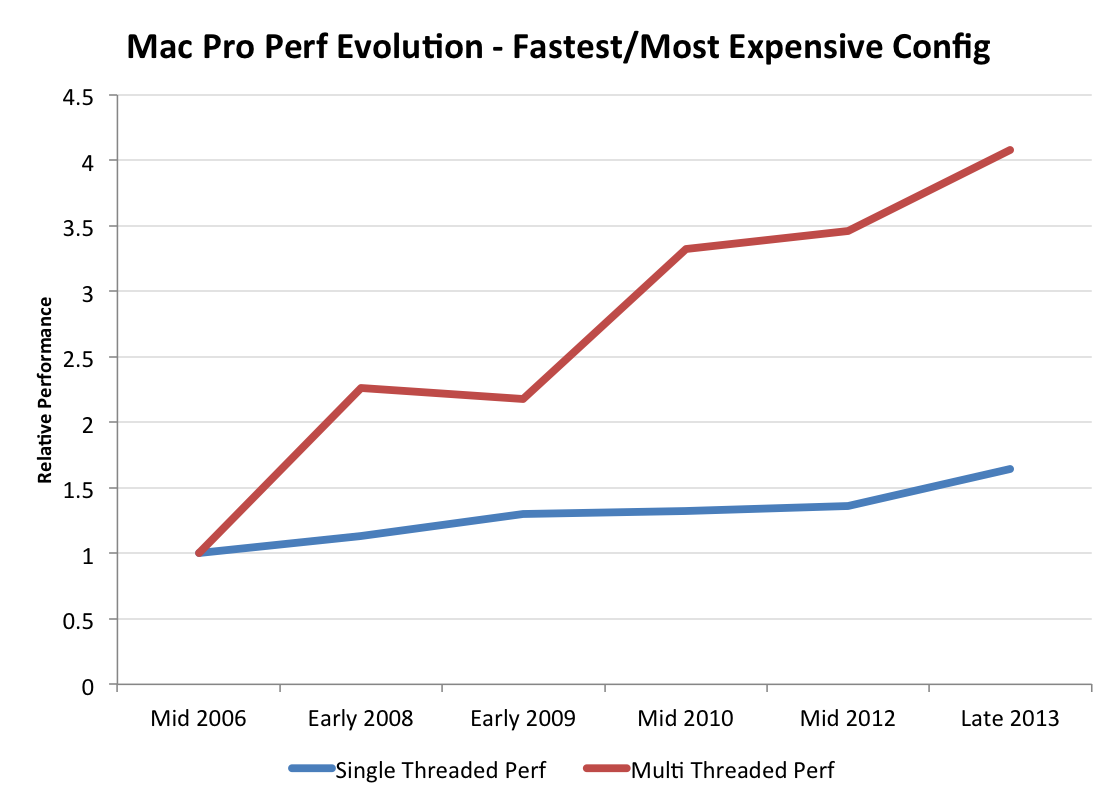
The single threaded performance improvement, by comparison, is fairly mild. If you bought the most expensive Mac Pro configuration back in 2006 you had a 3GHz part. In the past 7 years peak single core turbo has only improved by 30% to 3.9GHz. Granted there are other efficiency gains that help push the overall improvement north of 50%, but that’s assuming you haven’t purchased anything since 2006. If you bought into the Mac Pro somewhere in the middle and opted for a high-end configuration, you definitely won’t see an earth shattering increase in single threaded CPU performance. Note that we’re only looking at one vector of overall performance here. We aren’t taking into account things like storage and GPU performance improvements (yet).
For the third configuration I wanted to pick something in the middle. The issue is that there is no middle config for entirety of the Mac Pro’s history. In some cases shooting for the middle meant you’d end up with 4 cores, while other times it meant 6, 8 or 12. We settled on trying to shoot for a $4000 configuration each time and never go above it. It turns out that if you always had a $4000 budget for a Mac Pro and tried to optimize for CPU performance you’d end up with a somewhat bizarre upgrade path. The path we took is listed in the table below:
| Mac Pro - Mid-Range Configuration Upgrade Path | ||||||||||
| CPU | Chips | Cores per Chip | Total Cores / Threads | Clock Base/1CT/MaxCT | Launch Price | |||||
| Mid 2006 | Xeon 5160 | 2 | 2 | 4 / 4 | 3.0/3.0/3.0 GHz | $3299 | ||||
| Early 2008 | Xeon E5472 | 2 | 4 | 8 / 8 | 3.0/3.0/3.0 GHz | $3599 | ||||
| Early 2009 | Xeon W3580 | 1 | 4 | 4 / 8 | 3.33/3.6/3.46 GHz | $3699 | ||||
| Mid 2010 | Xeon W3680 | 1 | 6 | 6 / 12 | 3.33/3.6/3.46 GHz | $3699 | ||||
| Mid 2012 | Xeon E5645 | 2 | 6 | 12 / 24 | 2.4/2.67/2.4 GHz | $3799 | ||||
| Late 2013 | Xeon E5-1650 v2 | 1 | 6 | 6 / 12 | 3.5/3.9/3.6 GHz | $3999 | ||||
Around $4000 the Mac Pro went from a quad-core system to eight-cores, back down to four cores, then up to six, then twelve and finally settling back at six cores this generation. What this means is a cycling between improving single and multithreaded performance over the course of the past 7 years:
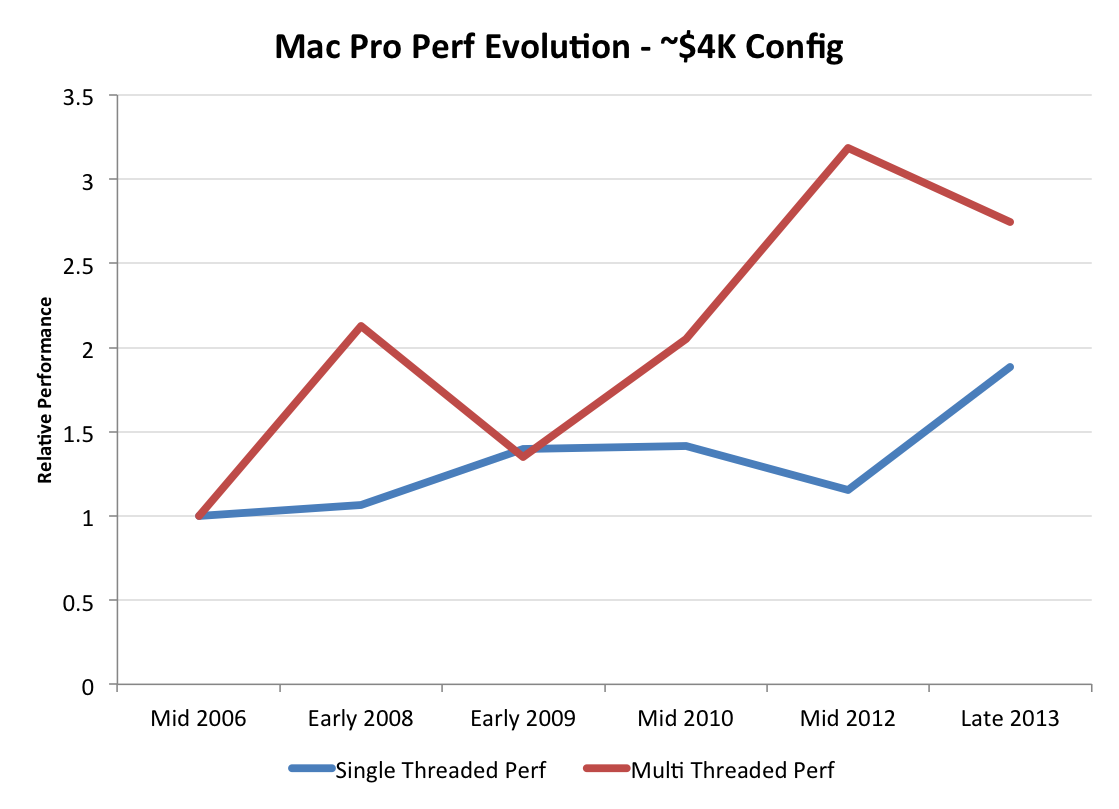
Here’s where the comparison gets really interesting. If you spent $3799 on a Mac Pro last year, in order to see a multithreaded performance uplift on the CPU side you’d need to spend more this year. Single threaded performance on the other hand sees a big uptick compared to last year. The 2012 $4K config is the outlier however, if you have a budget fixed at $4000 then a 2013 Mac Pro will be quicker in all aspects compared to any previous generation Mac Pro at the same price point.
The bigger takeaway from this is the following: the very same limited gains in CPU performance will eventually come to ultra mobile devices as well. It’s only a matter of time before those CPU curves flatten out. What that does to the smartphone/tablet market is a discussion for another day.


267 Comments
View All Comments
madwolfa - Tuesday, December 31, 2013 - link
Happy New Year!mwildtech - Tuesday, December 31, 2013 - link
Tahiti's roasting on an open fire... Whew!!mwildtech - Tuesday, December 31, 2013 - link
To be fair this was running Furmark and is not a realistic load on the gpu's. I would be interested in seeing the CPU and GPU temps while gaming in something like BF4. Anyway you guys could test it? Great review as always!wildpalms - Friday, January 3, 2014 - link
Gaming is not possible on the new Mac pro, at least not with any suitable level of performance. The GPU's are workstation class....and will crunch through rendering and other video type operations. Gaming will be lousy on these GPU's, as these are NOT the typical gaming type GPU's you may be used to.Haravikk - Monday, January 13, 2014 - link
That's not completely fair; the D700's are what, 7970 (R9 280?) equivalents, and they will work with CrossFireX under Windows, so they should run pretty well. Granted you're absolutely right that they're not gaming GPUs so you shouldn't expect them to beat a decent gaming rig, but they'll do in a pinch. Besides, mwildtech was asking what kind of temperature the Mac Pro would reach while running games, not whether it'll be any good at doing so.newrigel - Wednesday, March 1, 2017 - link
And the unified core will keep cool better than any water-based system and it won't leak and burn your computer up ha ha ha ha ha haeutectic - Tuesday, December 31, 2013 - link
Can I volunteer a Lightroom license for testing? I think export is much, much better threaded in v5; it'd be nice to see that benchmarked.knweiss - Thursday, January 2, 2014 - link
+1piroroadkill - Tuesday, December 31, 2013 - link
463W at the wall with a 450W DC power supply...Throttling to 2GHz, almost boiling GPU temps. Yeah, I think this machine could have done with being a bit larger to extend the mass of that heatsink, and include a PSU that won't be pushed to an unhealthy percentage of its maximum all the time.
mwildtech - Tuesday, December 31, 2013 - link
To be fair they was with Furmark and Prime 95 at the same time. Not a realistic load, Tahiti's running Furmark in a desktop in CFX can see similar temps with a AMD reference model. Also, 463w at the wall with 85% efficiency is only 393w being used by the workstation, seems within the safe limits.