Samsung SSD 845DC EVO/PRO Performance Preview & Exploring IOPS Consistency
by Kristian Vättö on September 3, 2014 8:00 AM ESTSamsung SSD 845DC EVO
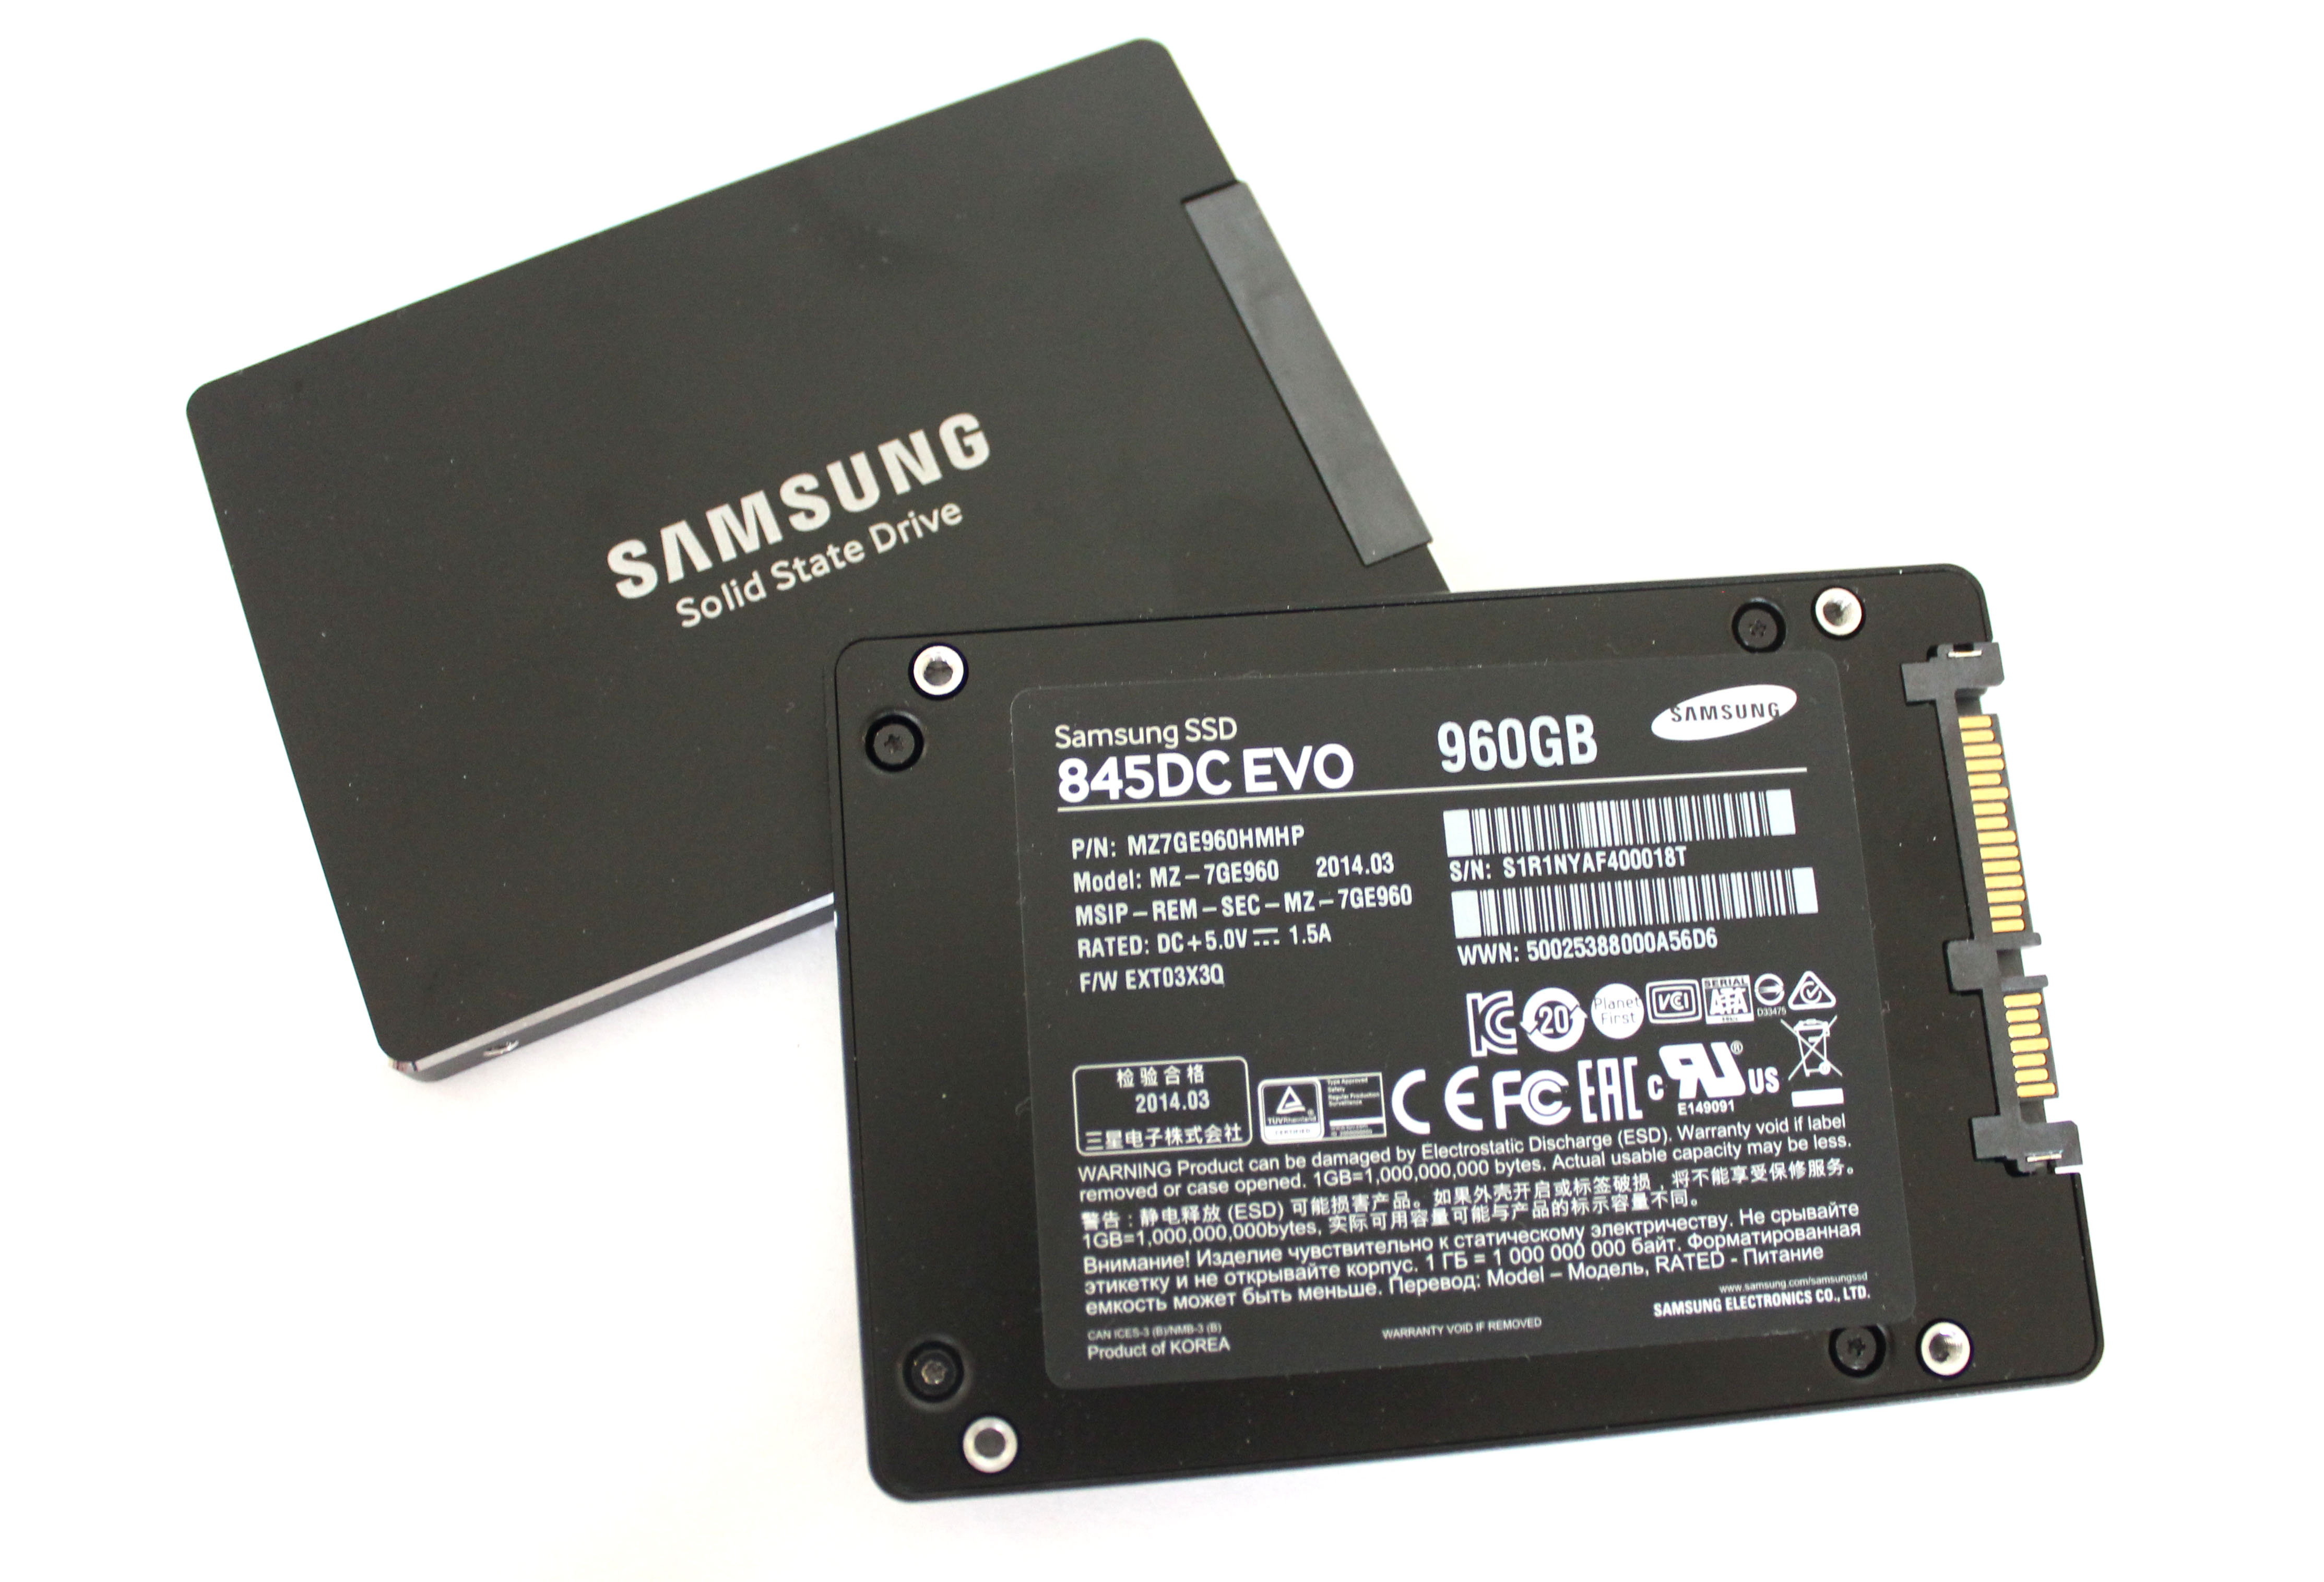
| Samsung SSD 845DC EVO | |||||
| Capacity | 240GB | 480GB | 960GB | ||
| Controller | Samsung MEX | ||||
| NAND | Samsung 19nm 128Gbit TLC | ||||
| Sequential Read | 530MB/s | 530MB/s | 530MB/s | ||
| Sequential Write | 270MB/s | 410MB/s | 410MB/s | ||
| 4KB Random Read | 87K IOPS | 87K IOPS | 87K IOPS | ||
| 4KB Random Write | 12K IOPS | 14K IOPS | 14K IOPS | ||
| Idle Power | 1.2W | 1.2W | 1.2W | ||
| Load Power (Read/Write) | 2.7W / 3.8W | 2.7W / 3.8W | 2.7W / 3.8W | ||
| Endurance (TBW) | 150TB | 300TB | 600TB | ||
| Endurance (DWPD) | 0.35 Drive Writes per Day | ||||
| Warranty | Five years | ||||
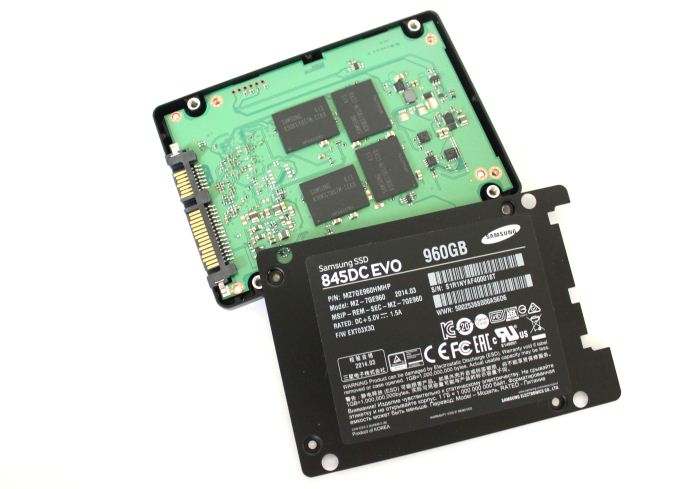
The 845DC EVO is based on the same MEX controller as the 840 EVO and 850 Pro are and it also uses the same 128Gbit 19nm TLC NAND as the EVO. While the SSD 840 was the first client TLC drive, the 845DC EVO is the first enterprise drive to utilize TLC NAND. We have covered TLC in detail multiple times by now, but in a nutshell TLC provides lower cost per gigabyte by storing three bits per cell instead of two like MLC does, but the increased density comes with a tradeoff in performance and endurance.
Based on our endurance testing, the TLC NAND in the SSD 840 and 840 EVO is good for 1,000 P/E cycles, which is about one third of what typical MLC is good for. I have not had the time to test the endurance of 845DC EVO yet, but based on tests run by others, the TLC NAND in the 845DC EVO is rated at 3,000 P/E cycles. I will confirm this in the full review, but assuming that the tests I've seen are accurate (they should be since the testing methology is essentially the same as what we do), Samsung has taken the endurance of TLC NAND to the next level.
I never believed that we would see 19nm TLC NAND with 3,000 P/E cycles because that is what MLC is typically rated at, but given the maturity of Samsung's 19nm process, it is plausible. Unfortunately I do not know if Samsung has done any special tricks to extend the endurance, but I would not be surprised if these were just super high binned dies. In the end, there are always better and worse dies in the wafer and with most TLC dies ending up in applications like USB flash drives and SD cards, the best of the best can be saved for the 845DC EVO.
Ultimately the 845DC EVO is still aimed mostly towards read-intensive workloads because 0.35 drive writes per day is not enough for anything write heavy in the enterprise sector. Interestingly, despite the use of TLC NAND the endurance of the EVO is actually slightly higher than what Intel's SSD DC S3500 offers (150TB vs 140TB at 240GB).

Like most enterprise drives, the 845DC EVO features capacitors to protect the drive against power losses. For client drives it is enough to flush the NAND mapping table from DRAM to NAND frequently enough to prevent corruption, but in the enterprise there is not much room for lost user data.


31 Comments
View All Comments
hojnikb - Wednesday, September 3, 2014 - link
Looks like, they ain't doing Turbowrite on TLC models :)Kristian Vättö - Wednesday, September 3, 2014 - link
TurboWrite wouldn't make any sense on an enterprise drive because all that matters is sustained performance. Client drives are a different case because IO activity tends to happen in bursts, so having a fast buffer is beneficial (and it makes the drive look better in benchmarks).hojnikb - Wednesday, September 3, 2014 - link
Yeah i figured as much. Aside from being more suited for short bursts (as you'd said) its really great for marketing department, since they can slap magical 500MB/s+ speeds, that every uninformed buyer is after. 500MB/s sure sells a lot better than 250MB/s (or even less, if we're dealing with lower capacities) :)Spirall - Wednesday, September 3, 2014 - link
Thanks for the article. Would suggest to make a $/manufacturer declared write endurance comparison (PB writen until manufacturer write warranty end). If there's a chance (due to the difficult on testing time) also make a $/tested write life (PB writen until tested dead).Kristian Vättö - Wednesday, September 3, 2014 - link
$/endurance is certainly something I will be looking at in the future. This was more of a preview than a full review and in the full review I will have more graphs and comparisons to support the conclusions :)As for actual endurance testing, that is something I will not do. It took me two weeks of continuos writing to get the rated endurance to drop by 1% in the 845DC PRO, so it would take way too long to wait for the drive to die.
hojnikb - Wednesday, September 3, 2014 - link
And there is a good chance, that thing would still go strong after rated endurance would drop to 0% (unless its hardcapped to die after that).Essence_of_War - Wednesday, September 3, 2014 - link
Another excellent article, Kristian.A question/comment, though, do you think it would make more sense to report the stdev measurements as an "error bar" attached to each data point rather than an additional graph with a 2nd y-axis? I think that might be more compact without having to worry about having multiple y-scales to read. Then it might even be possible to plot an average + error bars data set for multiple different SSDs on the same axis w/o having to worry about which curve is the avg, which curve is the stdev, etc.
hulu - Wednesday, September 3, 2014 - link
Another way to present the standard deviation data would be to draw it in two average +/- stdev graphs above and below the average graph. This would better allow visualizing the actual values the average minus stdev has.Kristian Vättö - Thursday, September 4, 2014 - link
Thanks for the suggestion. I will certainly look into alternative ways to present the standard deviation. I need to redo the graphs anyway for our new suite, so while I'm at it I can see if there is a better way to present the data.Essence_of_War - Thursday, September 4, 2014 - link
Best luck then, I'm sure you'll figure out a good way to do it.