Samsung SSD 845DC EVO/PRO Performance Preview & Exploring IOPS Consistency
by Kristian Vättö on September 3, 2014 8:00 AM ESTSamsung PM853T
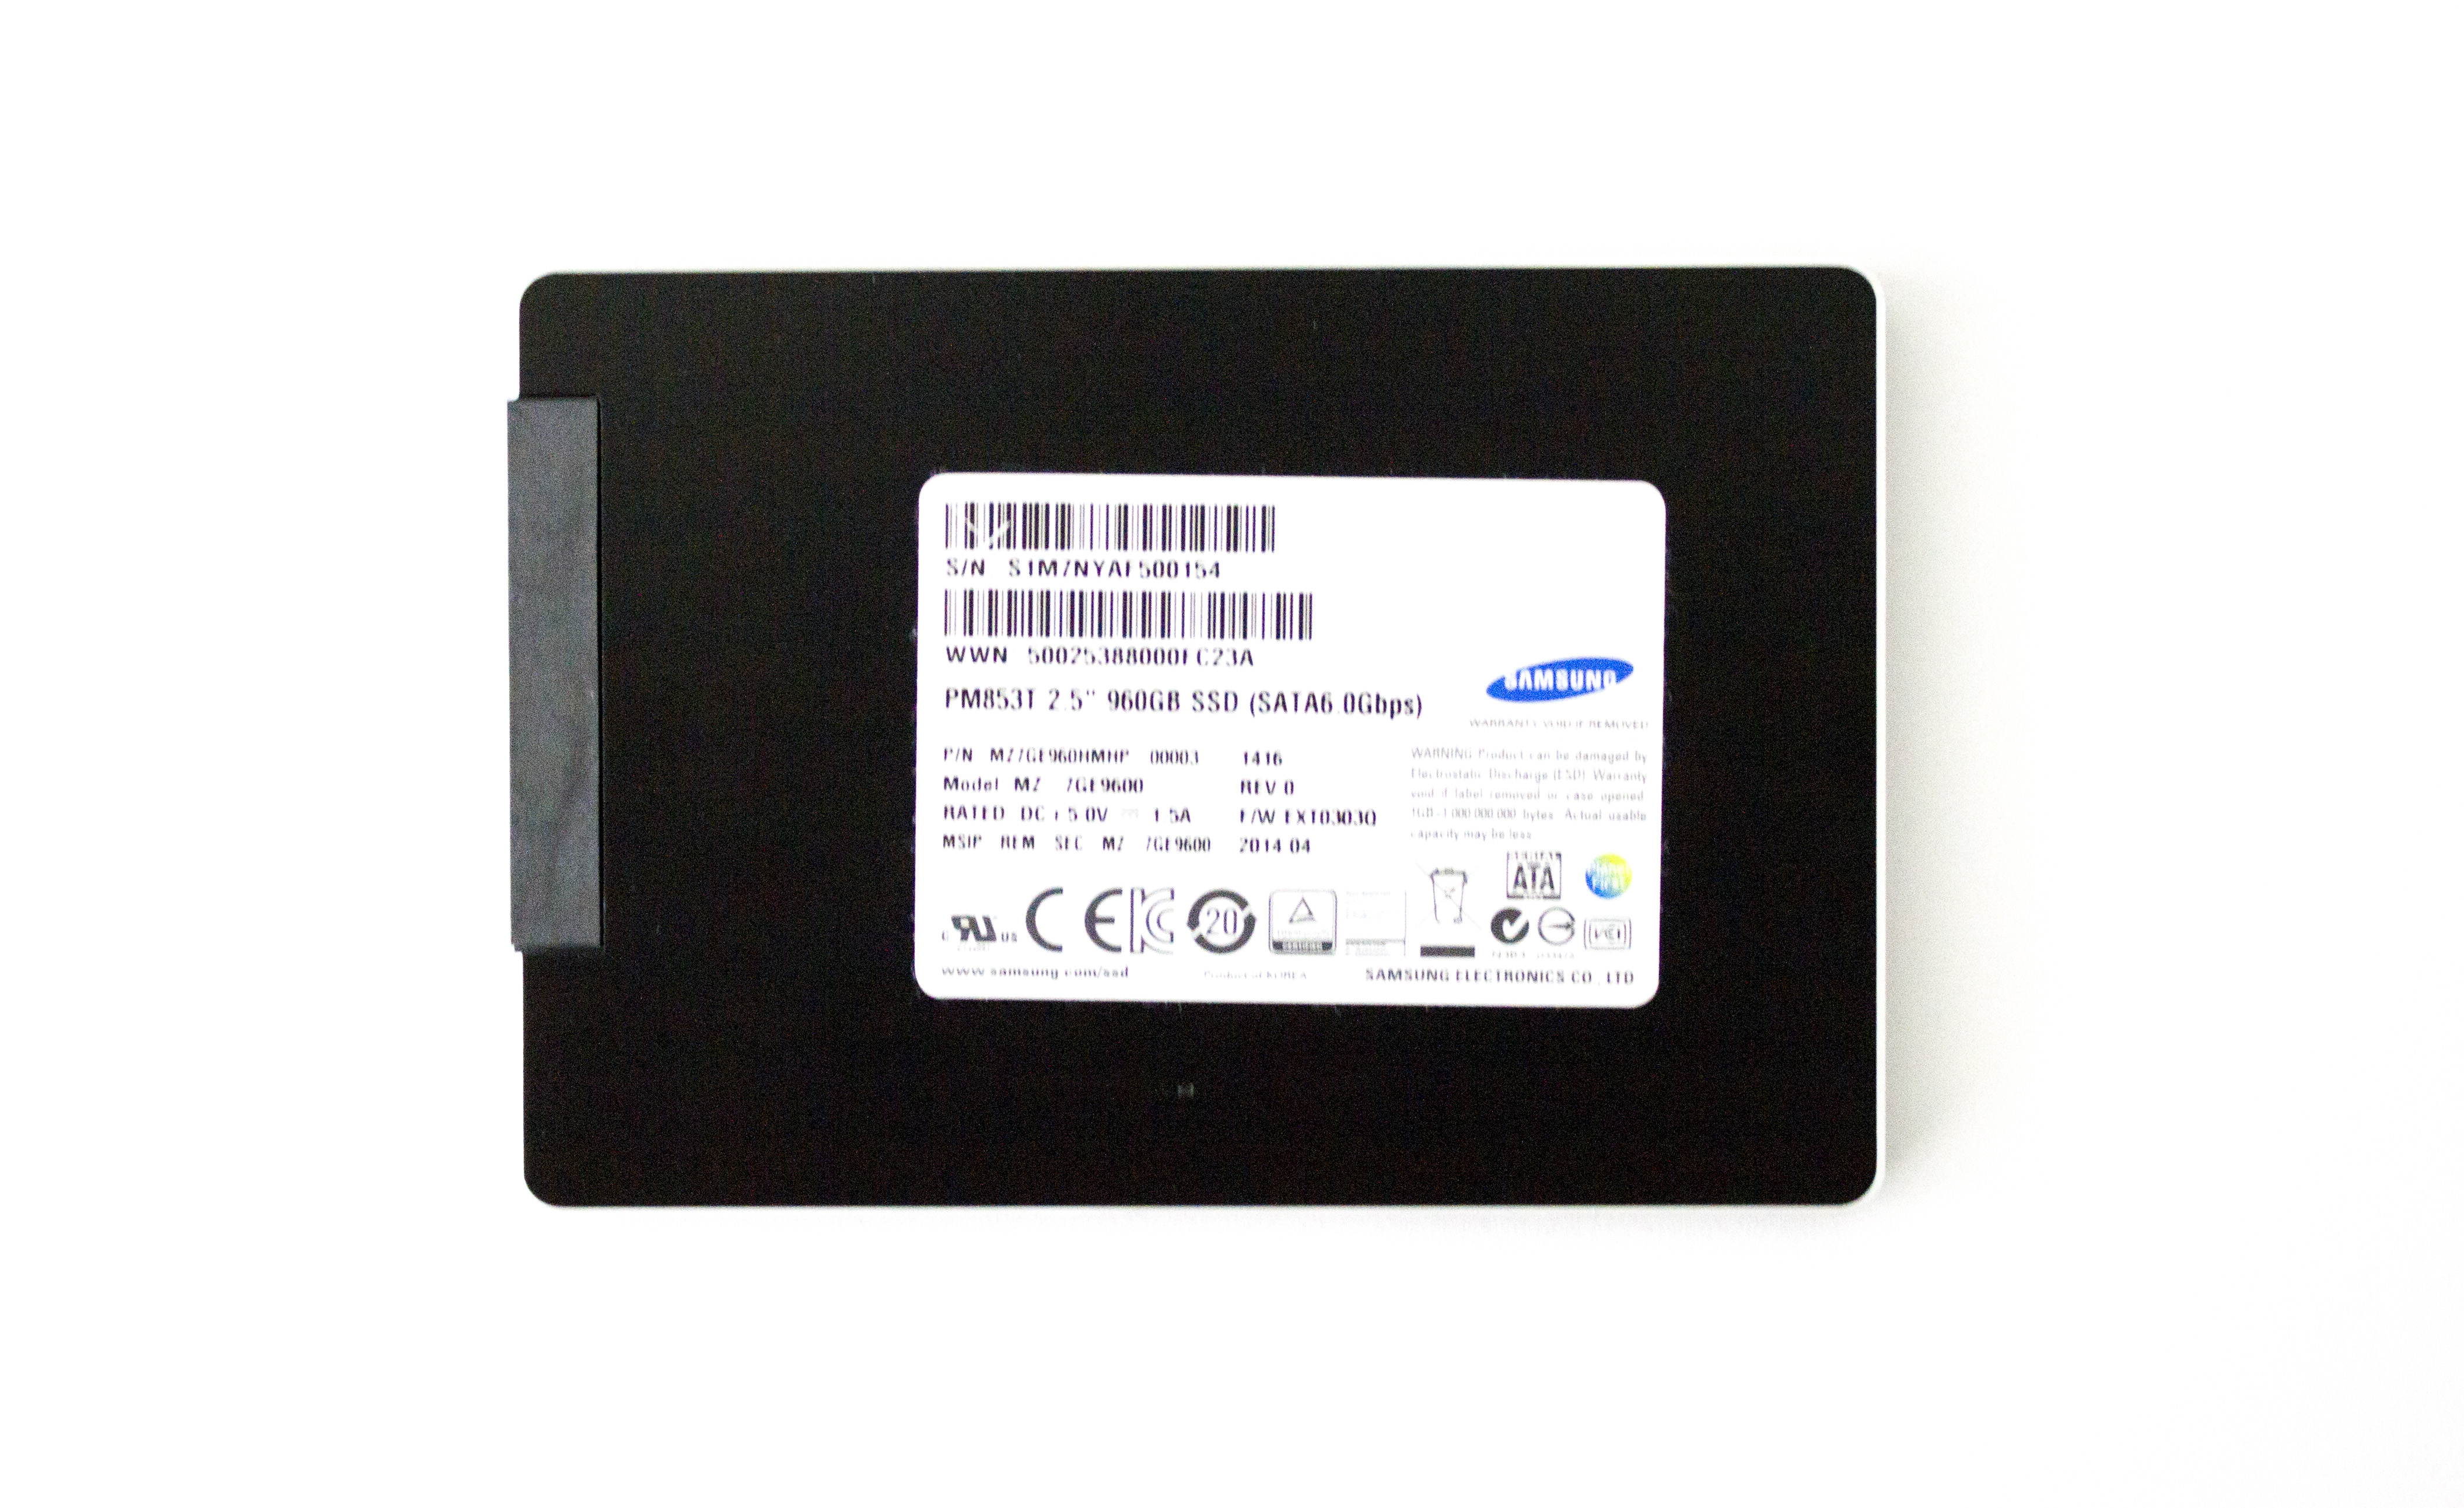
| Samsung PM853T | |||||
| Capacity | 240GB | 480GB | 960GB | ||
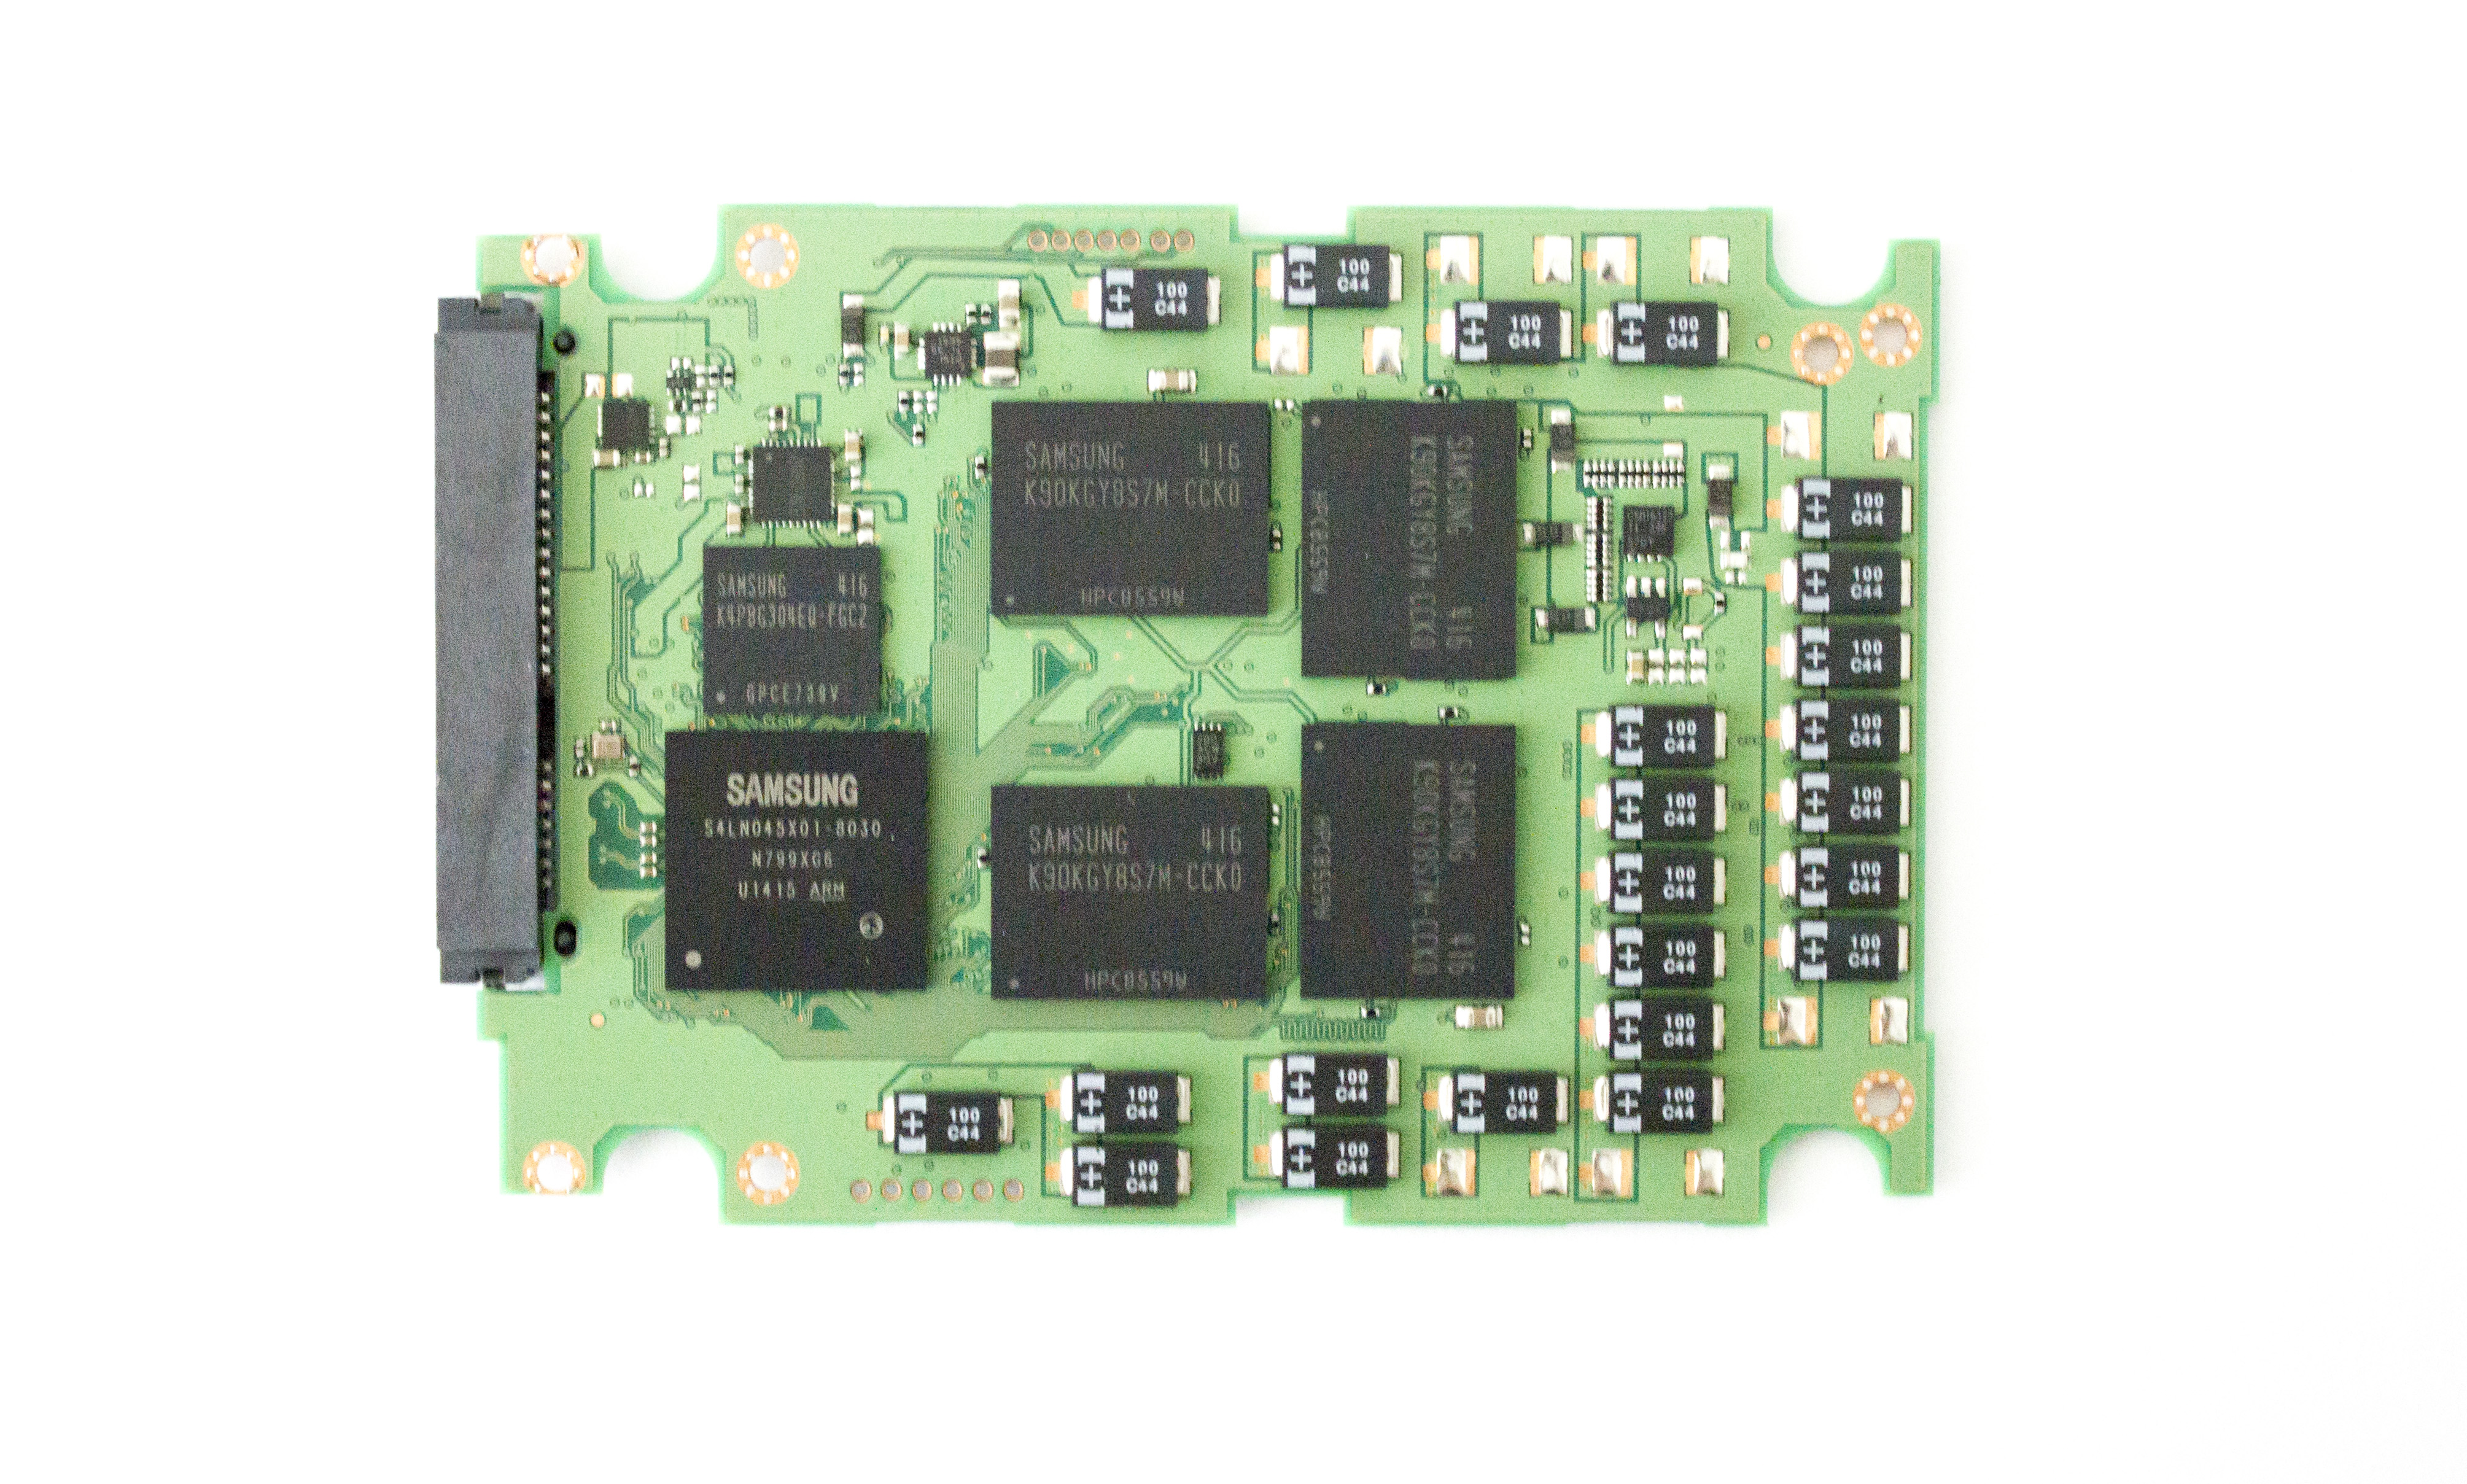
| Controller | Samsung MEX | ||||
| NAND | Samsung 19nm 128Gbit TLC | ||||
| Sequential Read | Up to 530MB/s | ||||
| Sequential Write | Up to 410MB/s | ||||
| 4KB Random Read | Up to 87K IOPS | ||||
| 4KB Random Write | Up to 15K IOPS | ||||
| Endurance (DWPD) | 0.3 DWPD (4KB Random) / 1.6 DWPD (64KB Sequential) | ||||
| Warranty | Three years | ||||
The PM853T is the OEM version of the 845DC EVO and as you would expect, the two are very much alike. The difference between the 845DC EVO and PM853T is the firmware and the PM853T is geared more towards sustained workloads, which results in slightly higher random write speed (15K IOPS vs 14K IOPS) for the highest capacity. Endurance is also a bit lower (0.3 DWPD vs 0.35 DWPD) and warranty has dropped from five to three years, but otherwise the 845DC EVO and PM853T should be alike. Unfortunately I do not have the full data sheet, so all the specs are 'up to', but I will update the table when I receive the full specs.


31 Comments
View All Comments
Laststop311 - Wednesday, September 3, 2014 - link
Wish the consumer m2 drives would be released already. Samsung sm951 with pcie gen 3.0 x4 controller would be nice to be able to buy.tuxRoller - Wednesday, September 3, 2014 - link
All chart titles are the same on page five (performance consistency average iops).tuxRoller - Wednesday, September 3, 2014 - link
Actually, all the charts carry the same title, but different data.Kristian Vättö - Thursday, September 4, 2014 - link
The titles are basically "name of the SSD and its capacity - 4KB Random Write (QD32) Performance". The name of the SSD should change when you select a different SSD but every graph has the "4KB Random Write (QD32) Performance" attached to it.CountDown_0 - Wednesday, September 3, 2014 - link
Hi Kristian,a small suggestion: when talking about worst case IOPS you write that "The blue dots in the graphs stand for average IOPS just like before, but the red dots show the worst-case IOPS for every second." Ok, but I'd write it in the graph legend instead.
Kristian Vättö - Thursday, September 4, 2014 - link
It's something I thought about and can certainly consider adding it in the future.rossjudson - Thursday, September 4, 2014 - link
I'd suggest the following. Use FIO to do your benchmarking. It supports generating and measuring just about every load you'd care about. You can also use it in a distributed mode, so you can run as many tests as you have hardware to support, at the same time.Second, don't use logarithmic axes on your charts. The drives you describe here take *huge* dropoffs in performance after their caches fill up and they have to start "working for a living". You are masking this performance drop by not using linear measures.
Third, divide up your time axis into (say) 60 second chunks, and show the min/max/95/99/99.9/99.9 latency marks. Most enterprise customers care about sustained performance and worst case performance. A really slow IO is going to hold up a bunch of other stuff. There are two ways out of that: Speculative IO (wait a little while for success then issue another IO to another device), or manage and interleave background tasks (defrag/garbage collect) very carefully in the storage device. Better yet, don't have the problem at all. The marketing stats on these drives have nothing to do with the performance they exhibit when they are subject to non-stop, mixed loads.
Unless you are a vendor that constantly tests precisely those loads, and ensures they work, stay working, and stay tight on latency.
SuperVeloce - Thursday, September 4, 2014 - link
Great review... but dropdown menu for graphs annoys me. ughKristian Vättö - Thursday, September 4, 2014 - link
What do you find annoying in them? I can certainly consider alternative options if you can suggest any.grebic - Thursday, October 2, 2014 - link
Hi Kristian. I need to bother you with a question: do you think isit worth it to stick this SSD in a NAS? I have a ''fanless'' QNAP HS-210, 2 bay small form NAS, without drives for the moment, so in order to have a complete zero noise and time ''resistence'' to go for SSDs. But I was forgoten what was mentioned here "no wear leveling, no garbage collection'', so I'm wondering if in time the performances will decrease dramatically I'm thinking that the OS of NAS is not knowing to do such ''treatments'' over SSDs for maintaining performances, no? It's not in my intention to do operations over operations on NAS but I would like to know that my data will be ''safe'' and easy ''accesible'' over long time, OK? Very appreciated your oppinion. Thanks, Cristian