The 2TB Samsung 850 Pro & EVO SSD Review
by Kristian Vättö on July 23, 2015 10:00 AM ESTPerformance Consistency
We've been looking at performance consistency since the Intel SSD DC S3700 review in late 2012 and it has become one of the cornerstones of our SSD reviews. Back in the days many SSD vendors were only focusing on high peak performance, which unfortunately came at the cost of sustained performance. In other words, the drives would push high IOPS in certain synthetic scenarios to provide nice marketing numbers, but as soon as you pushed the drive for more than a few minutes you could easily run into hiccups caused by poor performance consistency.
Once we started exploring IO consistency, nearly all SSD manufacturers made a move to improve consistency and for the 2015 suite, I haven't made any significant changes to the methodology we use to test IO consistency. The biggest change is the move from VDBench to Iometer 1.1.0 as the benchmarking software and I've also extended the test from 2000 seconds to a full hour to ensure that all drives hit steady-state during the test.
For better readability, I now provide bar graphs with the first one being an average IOPS of the last 400 seconds and the second graph displaying the IOPS divided by standard deviation during the same period. Average IOPS provides a quick look into overall performance, but it can easily hide bad consistency, so looking at standard deviation is necessary for a complete look into consistency.
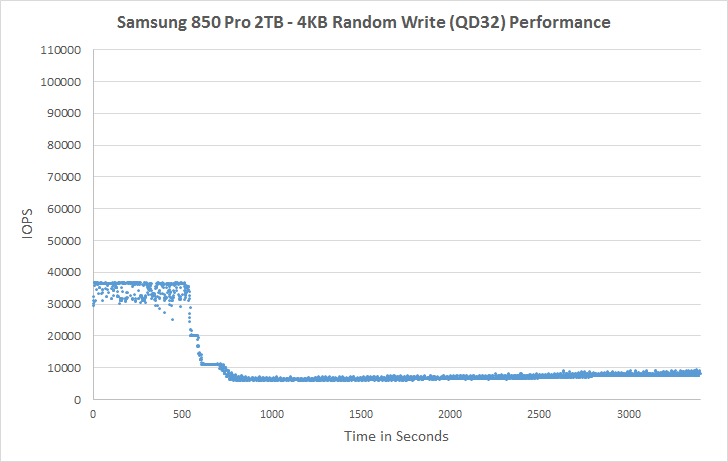
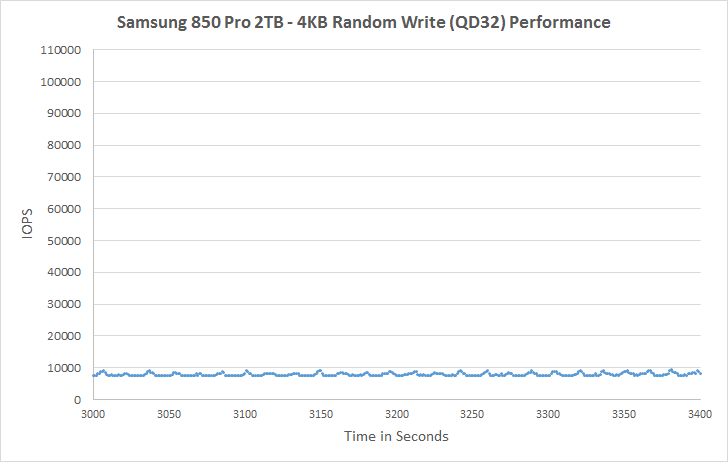
I'm still providing the same scatter graphs too, of course. However, I decided to dump the logarithmic graphs and go linear-only since logarithmic graphs aren't as accurate and can be hard to interpret for those who aren't familiar with them. I provide two graphs: one that includes the whole duration of the test and another that focuses on the last 400 seconds of the test to get a better scope into steady-state performance. These results are for all drives 240GB and up.
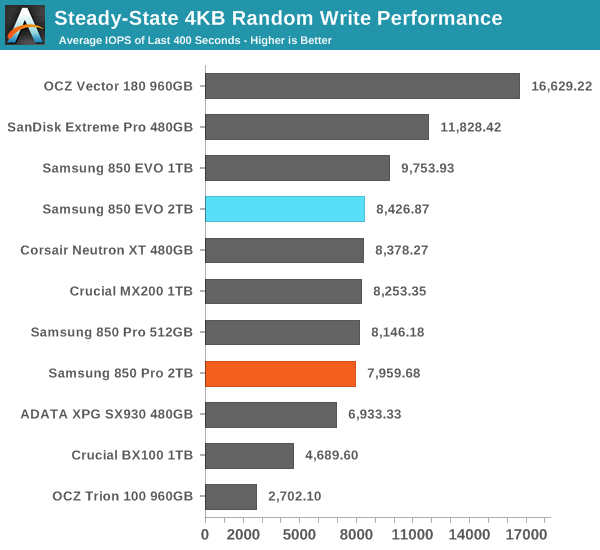
In steady-state 4KB random write performance the EVO is actually slightly faster than the Pro, but given that the EVO employs more over-provisioning (12% vs 7%), it's not out of the ordinary. The 2TB EVO performs slightly lower than the 1TB model, so it seems that despite the upgraded DRAM controller the controller may not be ideal for more than 1TB of NAND (internal SRAM caches and the like are the same as in the MEX controller). Nevertheless, the difference isn't substantial and in any case the Pro and EVO both boast excellent steady-state performance.
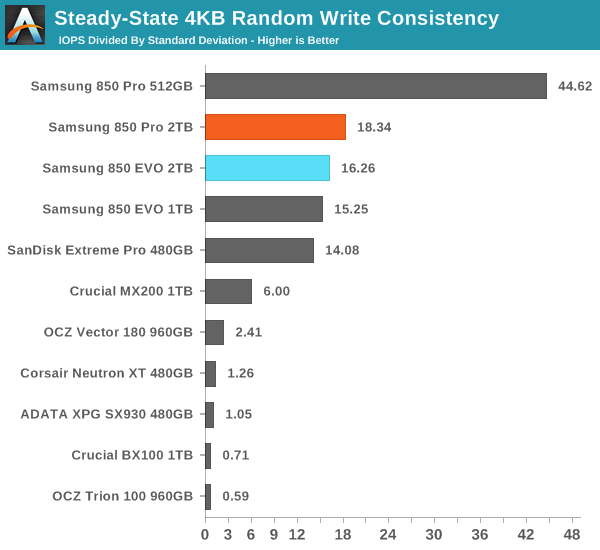
Both 2TB drives also have great consistency, although the 2TB Pro can't challenge the 512GB Pro that clearly leads the consistency graph. Given the same amount of raw processing power, managing less NAND is obviously easier because the more NAND there is, the more garbage collection calculations the controller has to process, which results in increased variation in performance.
 |
|||||||||
| Default | |||||||||
| 25% Over-Provisioning | |||||||||
The behavior in steady-state is similar to other 850 Pro and EVO drives, which is hardly surprising given the underlying firmware similarities. One area to note, though, is the increased performance variation with additional over-provisioning (OP), whereas especially the 512GB Pro presents very consistent performance with 25% OP. In any case, performance with additional OP is class-leading in both Pro and EVO.
 |
|||||||||
| Default | |||||||||
| 25% Over-Provisioning | |||||||||


66 Comments
View All Comments
Kristian Vättö - Thursday, July 23, 2015 - link
The move to Windows 8 broke compatibility with that method since HD Tach no longer works. I do have another idea, though, but I just haven't had the time to try it out and implement it to our test suite.editorsorgtfo - Thursday, July 23, 2015 - link
Kristian, what would you consider the best SATA 6Gbps drive(s) with power-loss protection?editorsorgtfo - Thursday, July 23, 2015 - link
Judging from the 850 Pro and EVO PCBs, they don't even guard their NAND mappings. Or my eyesight is giving.Meegul - Thursday, July 23, 2015 - link
It's mentioned at the end of 'The Destroyer' test that the 2TB 850 Pro uses less power than the 512GB variant, with one reason being cited as possibly a more efficient process node for the controller. Wouldn't it be more likely that the move to LPDDR3 in the 2TB variant was the cause for the increase in efficiency?MikhailT - Thursday, July 23, 2015 - link
He said that on the final words page as well: "I'm very glad to see improved power efficiency in the 2TB models. A part of that is explained by the move from LPDDR2 to LPDDR3, but it's also possible that the MHX is manufactured using a more power efficient process node. "MrCommunistGen - Thursday, July 23, 2015 - link
Kristian, I like that you give a little bit of love to the Mixed Sequential Read/Write graphs.Honestly this is the 1 area that I still find myself tearing out my hair waiting for on my Mid 2014 rMBP 1TB. I do a lot of work with large VMs in VMware and from time to time I have to copy one.
Peak read and Peak write speeds on this SSD are quite good, often approaching 1GB/s, but mixed sequential read/write is capped to an aggregate total of 1GB/s (yes I realize that this is bus limited on a x2 PCI-E 2.0 SSD).
This is one area that I really look forward to seeing improvements in with x4 PCI-E 3.0 SSDs.
jas.brooks - Sunday, March 13, 2016 - link
Hey MrCommunistGen,Just wondered if you could shed some light onto the Mixed Sequential Read/Write significance for you. I'm not super-tecchy personally, so it doesn't mean very much to me in those words alone.
BUT, I have been experiencing some very frustrating behaviour on my rMBP late-2013 (with 1TB built in SS-storage). When I'm using Premiere Pro CC2015 with video projects over a certain size (I'm a pro cameraman and editor, so am using heavy XAVC-I video from a Sony FS-7), then I get crazy lags waiting for a sequence to open, or specifically when making copy&paste commands. I have noticed that my (16GB) RAM is often near full in these situations, and there is a swap file in action too (between 1-16GB).
Any thoughts on my problem? More specifically, any possible ideas/suggestions of a config adjustment that could improve my experience? Or, is it simply the case that I'm pushing my machine too hard, and need to get a 32GB-RAM-cabable laptop ASAP?
Thanks!
jason
jcompagner - Thursday, July 23, 2015 - link
So they now have a way larger package/die for the pro version?Because with the 1TB evo and 1TB Pro i got the picture
both are exactly the same hardware only the evo stored 3 in 1 cell and the pro 2
(128GBit / 3 * 2 = 86GBit pro)
But now they both have 128GBit for the evo this i guess just means more of the same stuff
But for the Pro this has to mean that it has way more cells 50% more. So the die of the 2TB has to be 50% bigger then a one of the 1TB right?
Kristian Vättö - Saturday, July 25, 2015 - link
The 86Gbit MLC and 128Gbit TLC dies are not identical -- the TLC die is actually smaller (68.9mm^2 vs 87.4mm^2) due to it being a single-plane design. A lot more than the number of memory transistors goes into the die size, so estimating the die size based on the 50% increase in memory capacity alone isn't really possible.karakarga - Friday, July 24, 2015 - link
Why the read and write speeds not increasing? 550~540 Mb/s read and 520 MB/s write speeds, may reach 600 MB's there are still headroom!