HighPoint RocketStor RS6114V 4-Bay USB-C RAID Enclosure Review
by Ganesh T S on October 19, 2017 8:00 AM ESTPerformance with SSDs
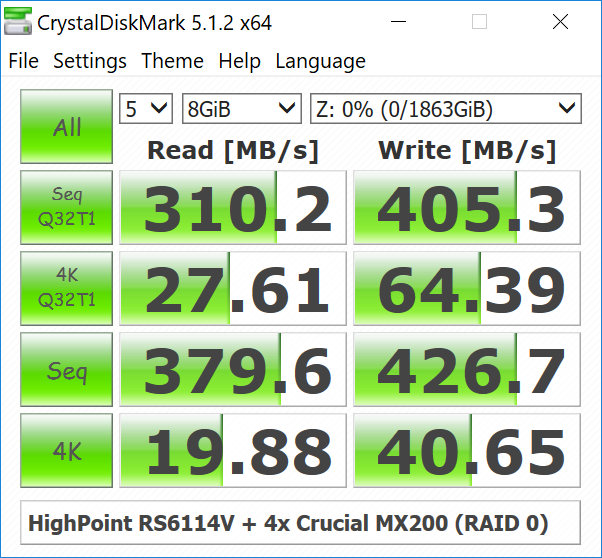
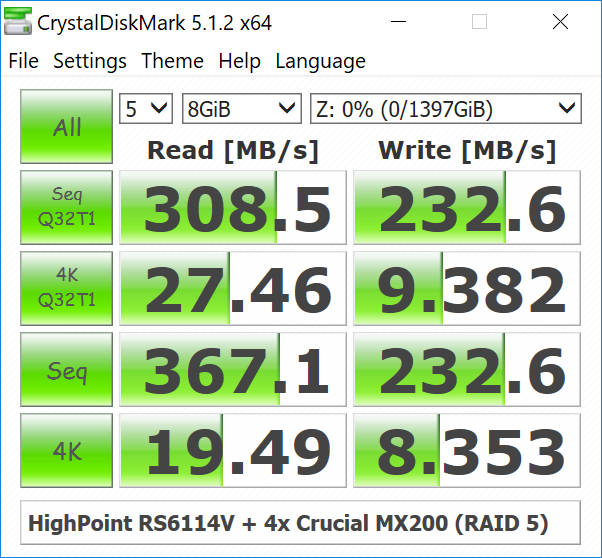
Storage bridges operate in the maximum possible performance mode when the storage media is able to saturate the SATA links. SSDs are best suited for this purpose. Our first set of tests help in understanding how the HighPoint RS6114V behaves with Crucial MX200 500GB SSDs in the drive bays.
CrystalDiskMark uses four different access traces for reads and writes over a configurable region size. Two of the traces are sequential accesses, while two are 4K rando accesses. Internally, CrystalDiskMark uses the Microsoft DiskSpd storage testing tool. The 'Seq Q32T1' sequential traces use 128K block size with a queue depth of 32 from a single thread, while the '4K Q32T1' ones do random 4K accesses with the same queue and thread configurations. The plain 'Seq' traces use a 1MiB block size. The plain '4K' ones are similar to the '4K Q32T1' except that only a single queue and single thread are used.
Comparing the '4K Q32T1' and '4K' numbers can quickly tell us whether the storage device supports NCQ (native command queuing) / UASP (USB-attached SCSI protocol). If the numbers for the two access traces are in the same ballpark, NCQ / UASP is not supported. This assumes that the host port / drivers on the PC support UASP. We can see that the RS6114V does support UASP, but, due to the software RAID, it is not as effective as what we saw in 2-bay hardware RAID enclosures.
| Storage Bridge Benchmarks - CrystalDiskMark | ||
 |
 |
|
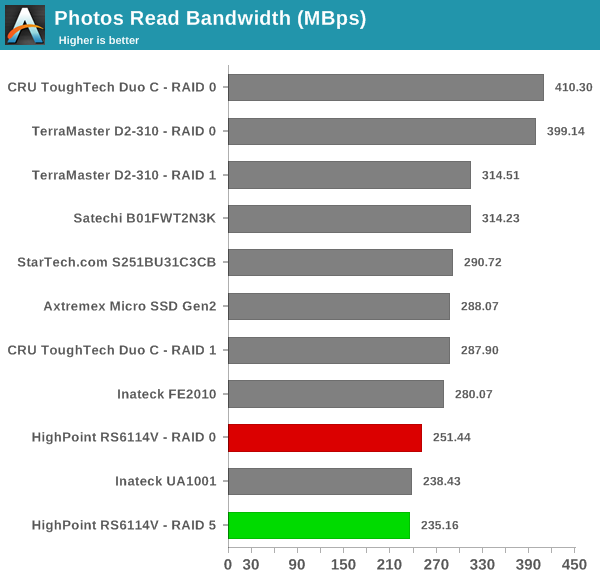
Moving on to the real-world benchmarks, we first look at the results from our custom robocopy test. In this test, we transfer three folders with the following characteristics.
- Photos: 15.6 GB collection of 4320 photos (RAW as well as JPEGs) in 61 sub-folders
- Videos: 16.1 GB collection of 244 videos (MP4 as well as MOVs) in 6 sub-folders
- BR: 10.7 GB Blu-ray folder structure of the IDT Benchmark Blu-ray (the same that we use in our robocopy tests for NAS systems)
The test starts off with the Photos folder in a RAM drive in the testbed. robocopy is used with default arguments to mirror it onto the storage drive under test. The content on the RAM drive is then deleted. robocopy is again used to transfer the content, but, from the storage drive under test to the RAM drive. The first segment gives the write speed, while the second one gives the read speed for the storage device. The segments end with the purge of the contents from the storage device. This process is repeated thrice and the average of all the runs is recorded as the performance number. The same procedure is adopted for the Videos and the BR folders. Readers interested in looking at all the graphs in one shot can choose the 'Expand All' option in the dropdown menu.
High-performance external storage devices can also be used for editing multimedia files directly off the unit. They can also be used as OS-to-go boot drives. Evaluation of this aspect is done using PCMark 8's storage bench. The storage workload involves games as well as multimedia editing applications. The command line version allows us to cherry-pick storage traces to run on a target drive. We chose the following traces.
- Adobe Photoshop (Light)
- Adobe Photoshop (Heavy)
- Adobe After Effects
- Adobe Illustrator
Usually, PC Mark 8 reports time to complete the trace, but the detailed log report has the read and write bandwidth figures which we present in our performance tables. Note that the bandwidth number reported in the results don't involve idle time compression. Results might appear low, but that is part of the workload characteristic. Note that the same CPU is being used for all configurations. Therefore, comparing the numbers for each trace should be possible across different DAS units. Readers interested in looking at all the graphs in one shot can choose the 'Expand All' option in the dropdown menu.
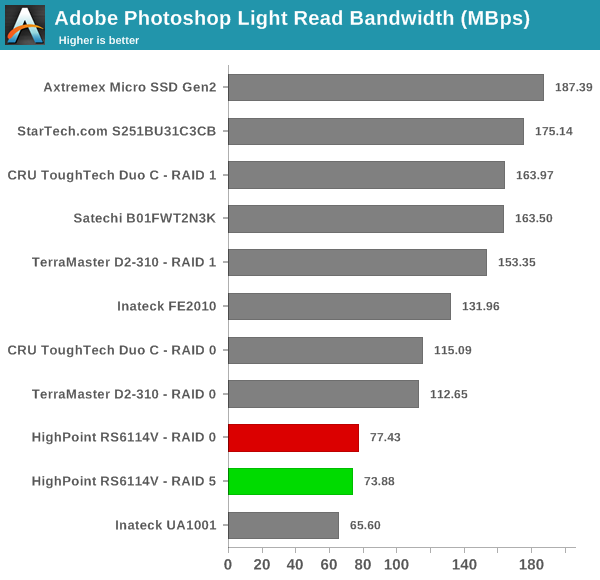
The above numbers make it clear that the enclosure is not intended to top performance charts. On the contrary, it is targeted towards consumers looking for a robust and easy to use solution backed by a proven RAID stack.
Thermal Aspects and Power Consumption
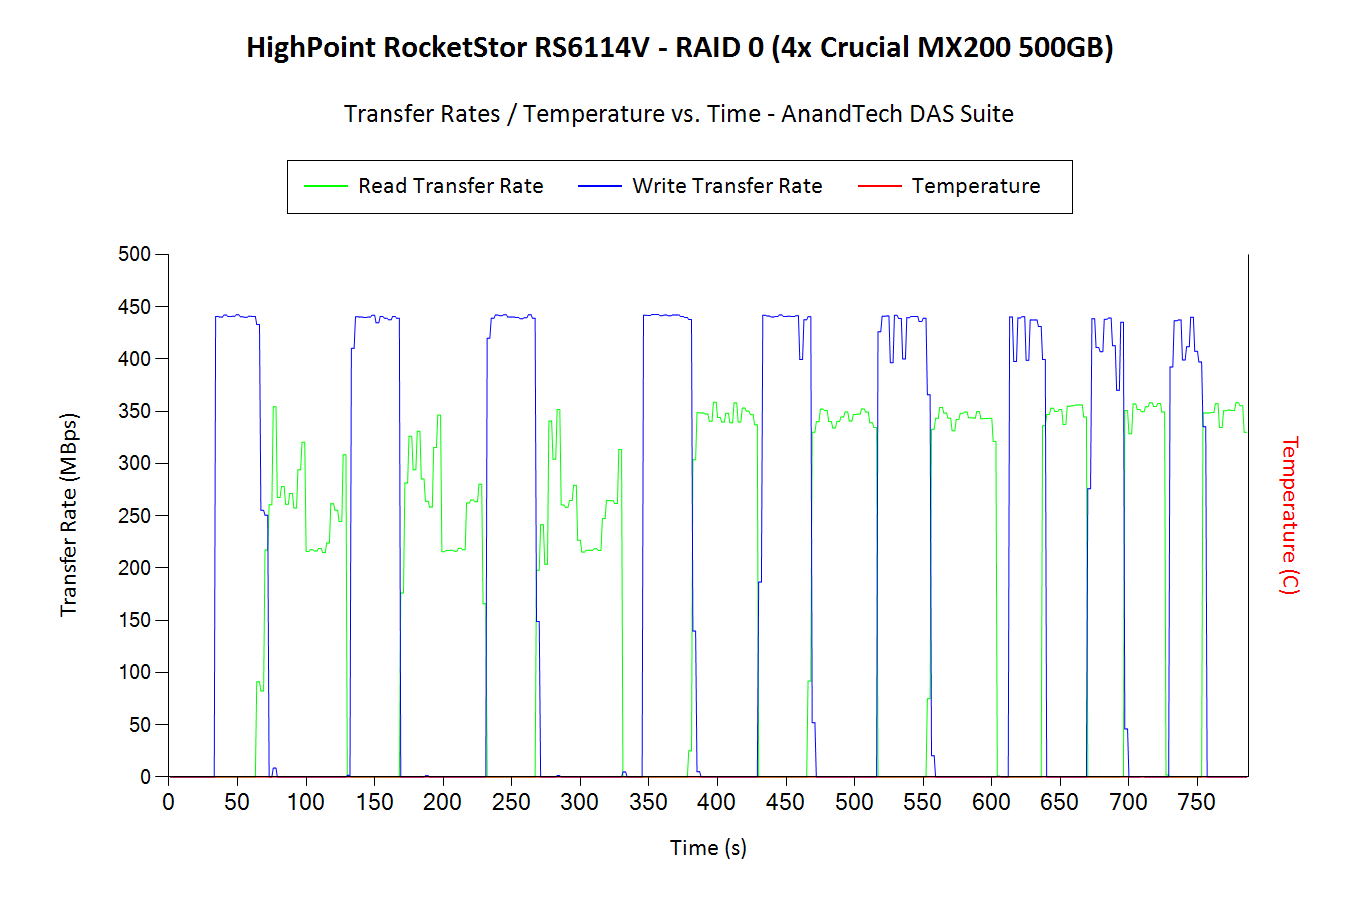
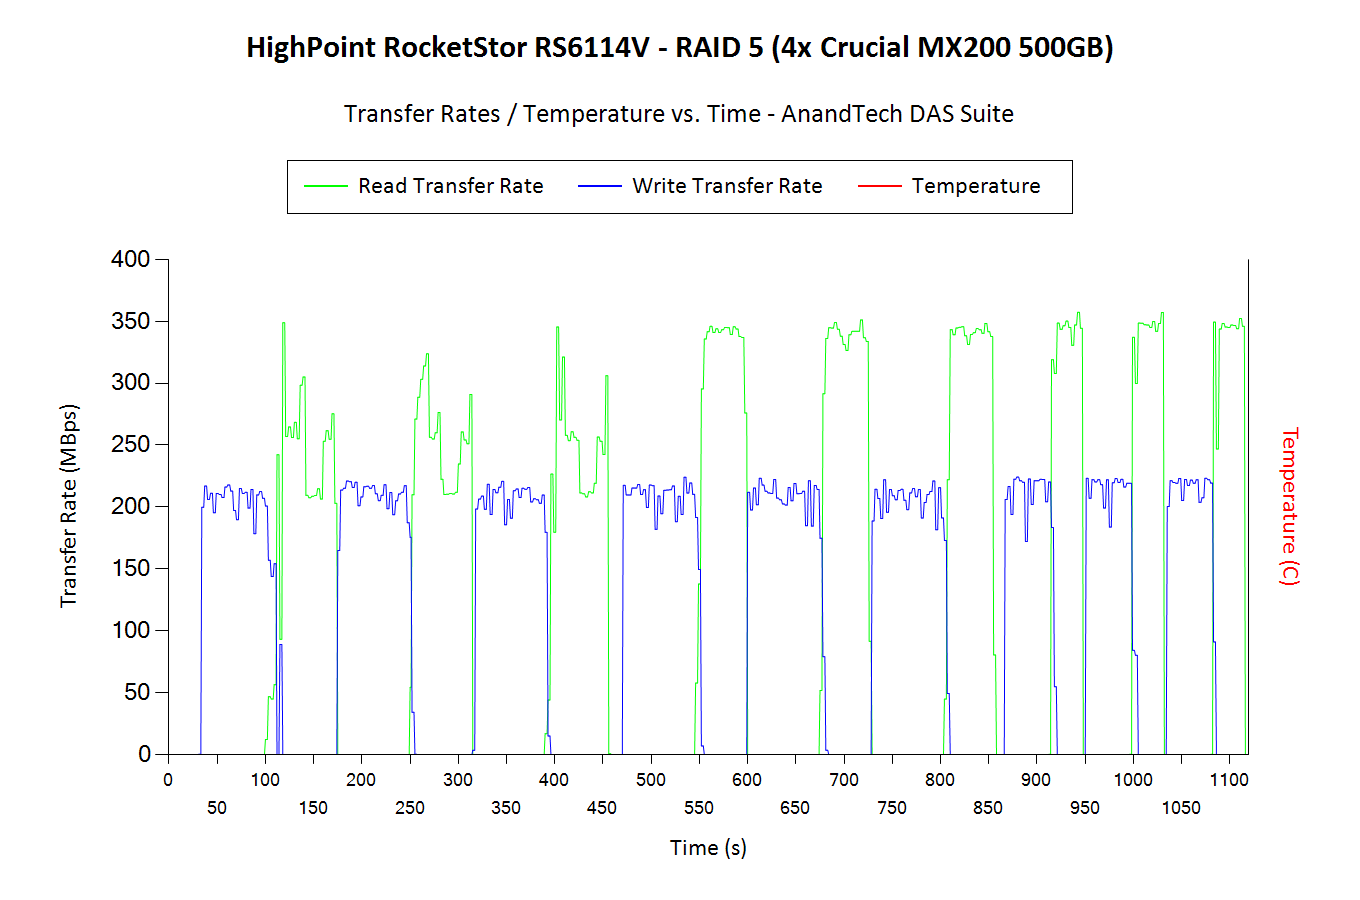
The thermal design of external storage enclosures has now come into focus, as high-speed SSDs and interfaces such as USB 3.1 Gen 2 can easily drive up temperatures. This aspect is an important one, as the last thing that users want to see when copying over, say, 100 GB of data to the drive inside the enclosure, is the transfer rate going to USB 2.0 speeds. In order to identify the effectiveness with which the enclosure can take away heat from the internal drive, we instrumented our robocopy DAS benchmark suite to record various parameters while the robocopy process took place in the background. Internal temperatures can only be gathered for enclosures that support S.M.A.R.T passthrough. Readers can click on the graphs below to view the full-sized version. We don't have the temperatures graphed for the RS6114V because it can only be monitored via the web UI. That said, we see absolutely no performance consistency issues, suggesting that the fans in the rear are doing their job effectively
| Storage Enclosure Thermal Characteristics | ||
 |
 |
|
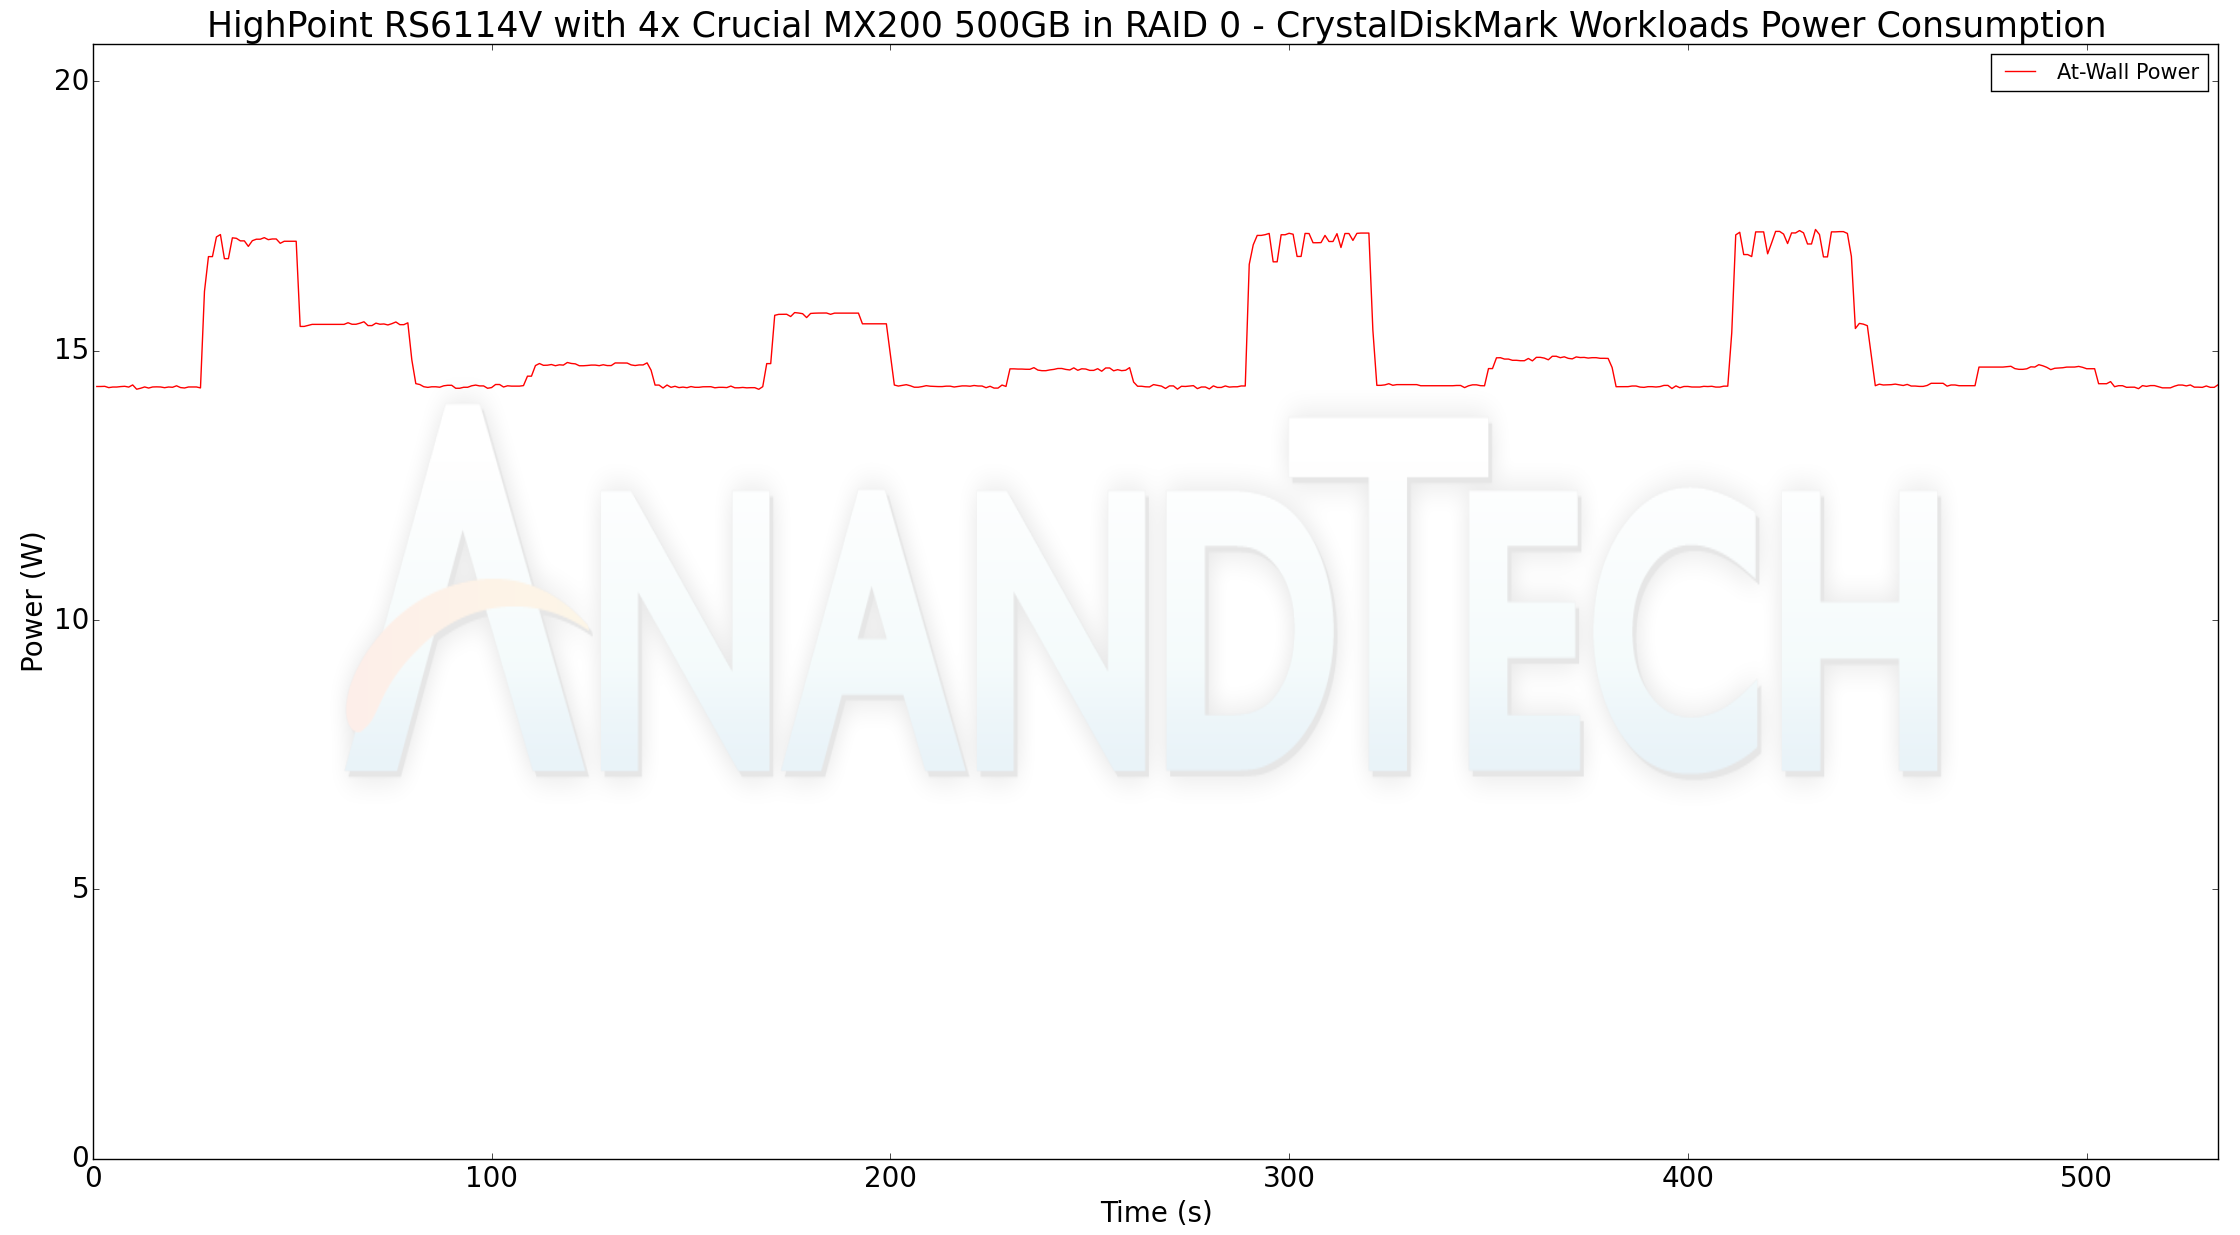
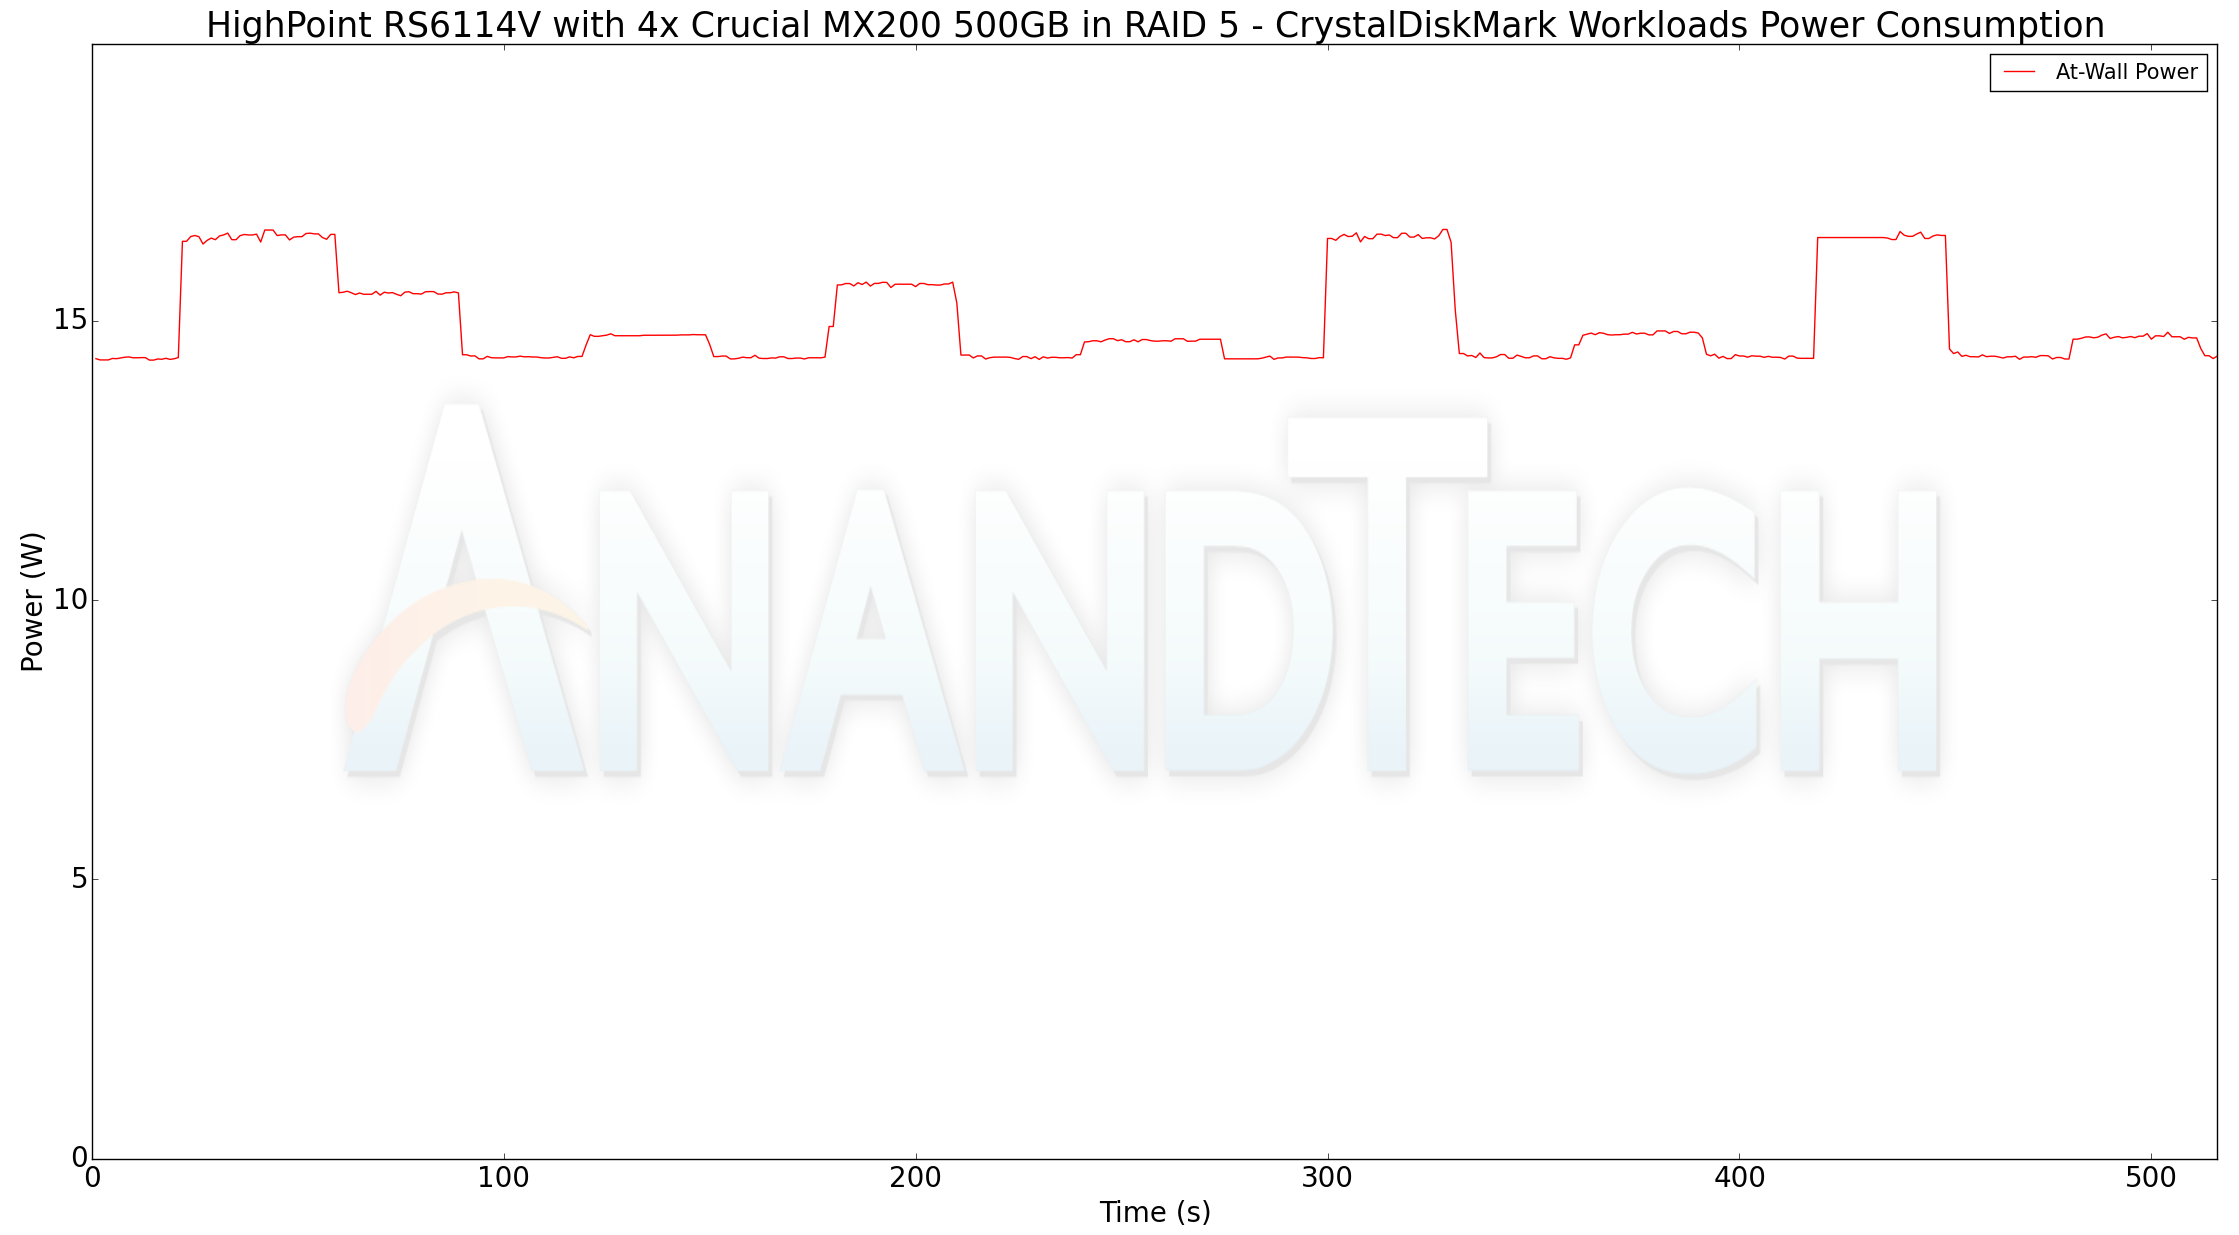
The power consumption at the wall was tracked while the CrystalDiskMark workloads were processed. The workloads were set up with an interval time of 30s. The numbers are graphed below for both RAID cases. The peak was around 16.8 W, while the unit with four SSDs idled around 14.9 W.
| Power Consumption - CrystalDiskMark | ||
 |
 |
|


9 Comments
View All Comments
MajGenRelativity - Thursday, October 19, 2017 - link
I enjoyed the well written article. I'm not the right person for this, but it's always good to keep up to date on different fieldsgchernis - Thursday, October 19, 2017 - link
I suspect the Xilinx chip will get warmer only when in RAID5. If so, they are using it to compute parity.ddriver - Friday, October 20, 2017 - link
Parity calculation is actually extremely simple and lightweight. Even for SSDs it will use milliwatts of power.gchernis - Thursday, October 19, 2017 - link
It's very hard to see temperatures on the Storage Enclosure Thermal Characteristics graphs... Great review, thank you Ganesh!HStewart - Friday, October 20, 2017 - link
I think this product will be really nice if it also supported TB3 - since it already supports USB C, it should be easy to support to TB3 especially now that Intel open it up.MajGenRelativity - Friday, October 20, 2017 - link
Thunderbolt 3 requires additional hardware beyond the USB C specification. While Intel opening the specification up makes it cheaper, it still is not free.Vidmo - Saturday, October 21, 2017 - link
Ganesh,Why do your performance numbers differ so much from this review?
https://www.servethehome.com/highpoint-rocketstor-...
They were seeing much higher numbers with CrystalDiskMark than you saw, both in RAID 0 and RAID 5.
ganeshts - Wednesday, October 25, 2017 - link
Their CDM testing parameters are different. We consistently use 5 passes with a 8GB working set. They appear to be using 3 passes with a 1GB working set. The numbers also heavily depend on the drives used in the enclosure - you can see the difference between the SSDs and the HDDs even in our review. Lastly, the enclosure relies on host system caching to some extent, and that might skew results for small working sets.galfert - Sunday, November 12, 2017 - link
I've been looking for a Thunderbolt 3 enclosure that supports NVMe and Trim. Does not seem to exist. I guess I'll keep waiting. Gotta be any day now already. Sheez!