The ASRock Z170 Extreme7+ Review: When You Need Triple M.2 x4 in RAID
by Ian Cutress on November 27, 2015 11:59 AM EST- Posted in
- Motherboards
- ASRock
- M.2
- Skylake
- Z170
System Performance
Not all motherboards are created equal. On the face of it, they should all perform the same and differ only in the functionality they provide - however this is not the case. The obvious pointers are power consumption, but also the ability for the manufacturer to optimize USB speed, audio quality (based on audio codec), POST time and latency. This can come down to manufacturing process and prowess, so these are tested.
Power Consumption
Power consumption was tested on the system while in a single MSI GTX 770 Lightning GPU configuration with a wall meter connected to the OCZ 1250W power supply. This power supply is Gold rated, and as I am in the UK on a 230-240 V supply, leads to ~75% efficiency > 50W, and 90%+ efficiency at 250W, suitable for both idle and multi-GPU loading. This method of power reading allows us to compare the power management of the UEFI and the board to supply components with power under load, and includes typical PSU losses due to efficiency. These are the real world values that consumers may expect from a typical system (minus the monitor) using this motherboard.
While this method for power measurement may not be ideal, and you feel these numbers are not representative due to the high wattage power supply being used (we use the same PSU to remain consistent over a series of reviews, and the fact that some boards on our test bed get tested with three or four high powered GPUs), the important point to take away is the relationship between the numbers. These boards are all under the same conditions, and thus the differences between them should be easy to spot.
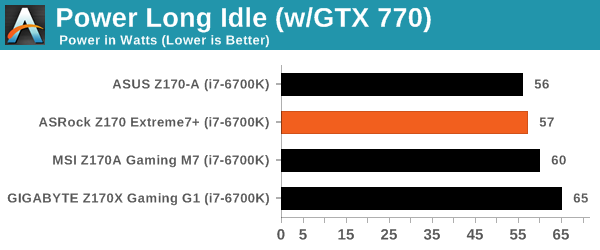
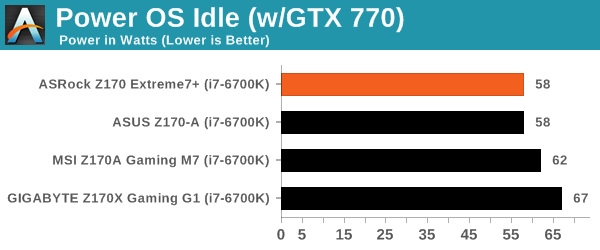
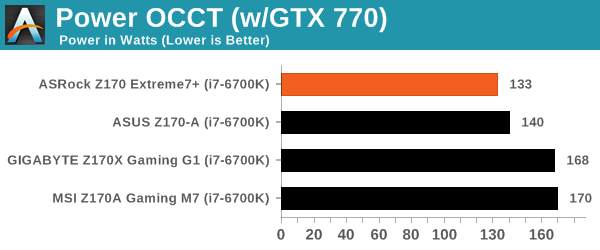
While the ASRock was not strictly the lowest consumer of power at idle, when we look at the idle to load differential, it shows a 73W gain for the i7-6700K, compared to the 110W seen on the MSI. This is in part because we saw a number of the early motherboard BIOSes overestimate the load voltage required at stock, as well as an element of MultiCore Turbo keeping voltages high. But in this case, because the ASRock does not have multicore turbo, it saves power at the wall.
Non UEFI POST Time
Different motherboards have different POST sequences before an operating system is initialized. A lot of this is dependent on the board itself, and POST boot time is determined by the controllers on board (and the sequence of how those extras are organized). As part of our testing, we look at the POST Boot Time using a stopwatch. This is the time from pressing the ON button on the computer to when Windows 7 starts loading. (We discount Windows loading as it is highly variable given Windows specific features.)
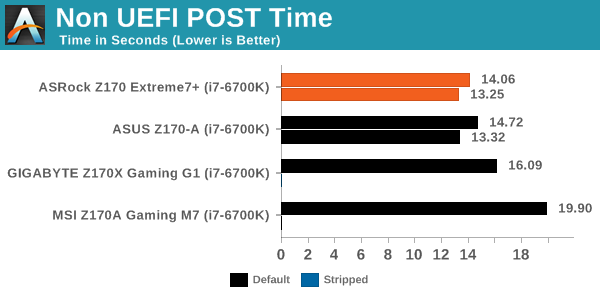
Because this is still early days for the Z170 platform, POST times are seemingly all over the place as motherboard manufacturers optimize their boot routines. Nevertheless, the ASRock comes out on top in its default setting, over the ASUS, GIGABYTE and way ahead of the MSI.
Rightmark Audio Analyzer 6.2.5
Rightmark:AA indicates how well the sound system is built and isolated from electrical interference (either internally or externally). For this test we connect the Line Out to the Line In using a short six inch 3.5mm to 3.5mm high-quality jack, turn the OS speaker volume to 100%, and run the Rightmark default test suite at 192 kHz, 24-bit. The OS is tuned to 192 kHz/24-bit input and output, and the Line-In volume is adjusted until we have the best RMAA value in the mini-pretest. We look specifically at the Dynamic Range of the audio codec used on board, as well as the Total Harmonic Distortion + Noise.
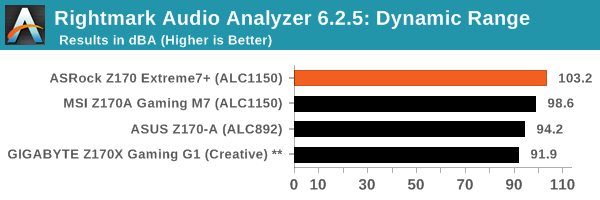
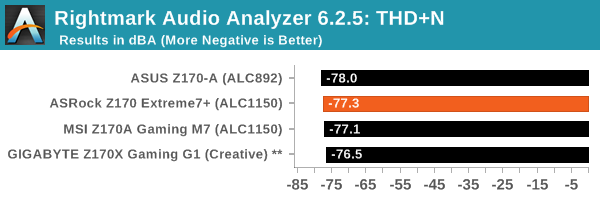
Using the ALC1150 and an improved design should put the ASRock implementation near the top for audio, and the -103 dBA result for SNR shows it.
USB Backup
For this benchmark, we transfer a set size of files from the SSD to the USB drive using DiskBench, which monitors the time taken to transfer. The files transferred are a 1.52 GB set of 2867 files across 320 folders – 95% of these files are small typical website files, and the rest (90% of the size) are small 30 second HD videos. In an update to pre-Z87 testing, we also run MaxCPU to load up one of the threads during the test which improves general performance up to 15% by causing all the internal pathways to run at full speed.
Due to the introduction of USB 3.1, as of June 2015 we are adjusting our test to use a dual mSATA USB 3.1 Type-C device which should be capable of saturating both USB 3.0 and USB 3.1 connections. We still use the same data set as before, but now use the new device. Results are shown as seconds taken to complete the data transfer.
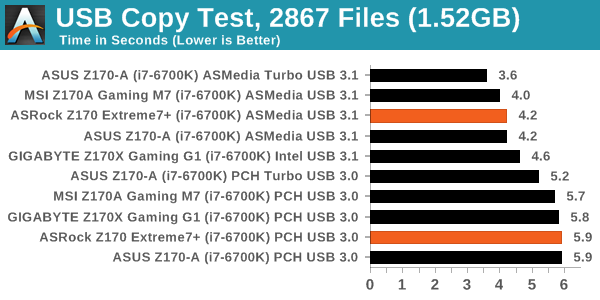
Like most of the USB 3.1 enabled motherboards on launch day, the ASMedia controller for the USB ports performs well although there does seem to see some variation in results as this is also optimized in firmware and drivers.
DPC Latency
Deferred Procedure Call latency is a way in which Windows handles interrupt servicing. In order to wait for a processor to acknowledge the request, the system will queue all interrupt requests by priority. Critical interrupts will be handled as soon as possible, whereas lesser priority requests such as audio will be further down the line. If the audio device requires data, it will have to wait until the request is processed before the buffer is filled.
If the device drivers of higher priority components in a system are poorly implemented, this can cause delays in request scheduling and process time. This can lead to an empty audio buffer and characteristic audible pauses, pops and clicks. The DPC latency checker measures how much time is taken processing DPCs from driver invocation. The lower the value will result in better audio transfer at smaller buffer sizes. Results are measured in microseconds.
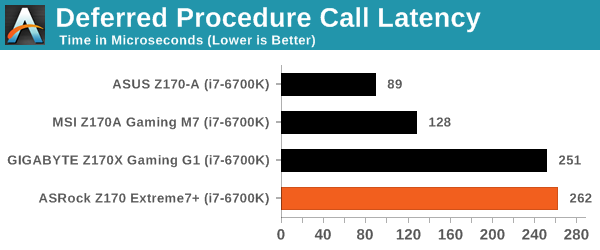
For whatever reason, our DPC result came back rather poorly here. We’re not sure if it’s just a BIOS not set up for DPC Latency, or something more fundamental. As time goes on and the platform matures, we’ll see more motherboards underneath 100.


63 Comments
View All Comments
zeeBomb - Friday, November 27, 2015 - link
Whoa!!!dsumanik - Thursday, December 17, 2015 - link
AT Theres a typo in the headline, here's the correction:The ASRock Z170 Extreme7+ Review: When You Don't Test The Headline Feature Of The Motherboard.
Otherwise knows as: We didn't do our job, but trust us it's awesome and buy it anyways.
Seriously AT?
*Facepalm
daos - Friday, December 18, 2015 - link
I completely agree! Hasn't been the same since Anand leftpedjache - Friday, November 27, 2015 - link
In one of AT's previous articles, it was stated that the gtx770 used in tests gave odd results in Shadow of Mordor while the network connection was on, and said the matter will be looked into and reported. Anything on that?(more) on topic - nice review, wonderful motherboard, and kudos for praising them engineers, I happen to know they love and can't get enough of it.
Ian Cutress - Friday, November 27, 2015 - link
Still looking into it.flameyyy - Saturday, November 28, 2015 - link
do the DPC latency issues have anything to do with the bugged intel networking drivers? https://communities.intel.com/thread/54594evilspoons - Friday, November 27, 2015 - link
The Board Features/Visual Inspection page appears to be blank except for an introductory paragraph, as of 10:32 AM mountain time.evilspoons - Friday, November 27, 2015 - link
Also, it's a shame the headlining feature (triple M2 x4 in RAID) wasn't actually benchmarked. I would have loved to see 3x Samsung 950 Pro drives jammed in this sucker.eddieobscurant - Friday, November 27, 2015 - link
They will all share the same pci 3.0 x4 lanes, so there is a cap at 3.2 gb/s for the raid array. The thessdreview has a review of this combination.Flunk - Friday, November 27, 2015 - link
That's GB/s, which is 8x as much.