Lexar Professional Workflow HR2 4-Bay Thunderbolt 2 / USB 3.0 Reader Hub Review
by Ganesh T S on June 22, 2017 8:00 AM ESTEvaluation Methodology
The Lexar Professional Workflow HR2 hub, various card readers, and the memory cards were evaluated using a tweaked version of our traditional direct-attached storage testing workflow. While the hardware (the AnandTech DAS Testbed, whose specifications are outlined in the table below) was reused as-is, we had to make some changes in the software tools used for benchmarking.
| AnandTech DAS Testbed Configuration | |
| Motherboard | GIGABYTE Z170X-UD5 TH ATX |
| CPU | Intel Core i5-6600K |
| Memory | G.Skill Ripjaws 4 F4-2133C15-8GRR 32 GB ( 4x 8GB) DDR4-2133 @ 15-15-15-35 |
| OS Drive | Samsung SM951 MZVPV256 NVMe 256 GB |
| SATA Devices | Corsair Neutron XT SSD 480 GB Intel SSD 730 Series 480 GB |
| Add-on Card | None |
| Chassis | Cooler Master HAF XB EVO |
| PSU | Cooler Master V750 750 W |
| OS | Windows 10 Pro x64 |
| Thanks to Cooler Master, GIGABYTE, G.Skill, and Intel for the build components | |
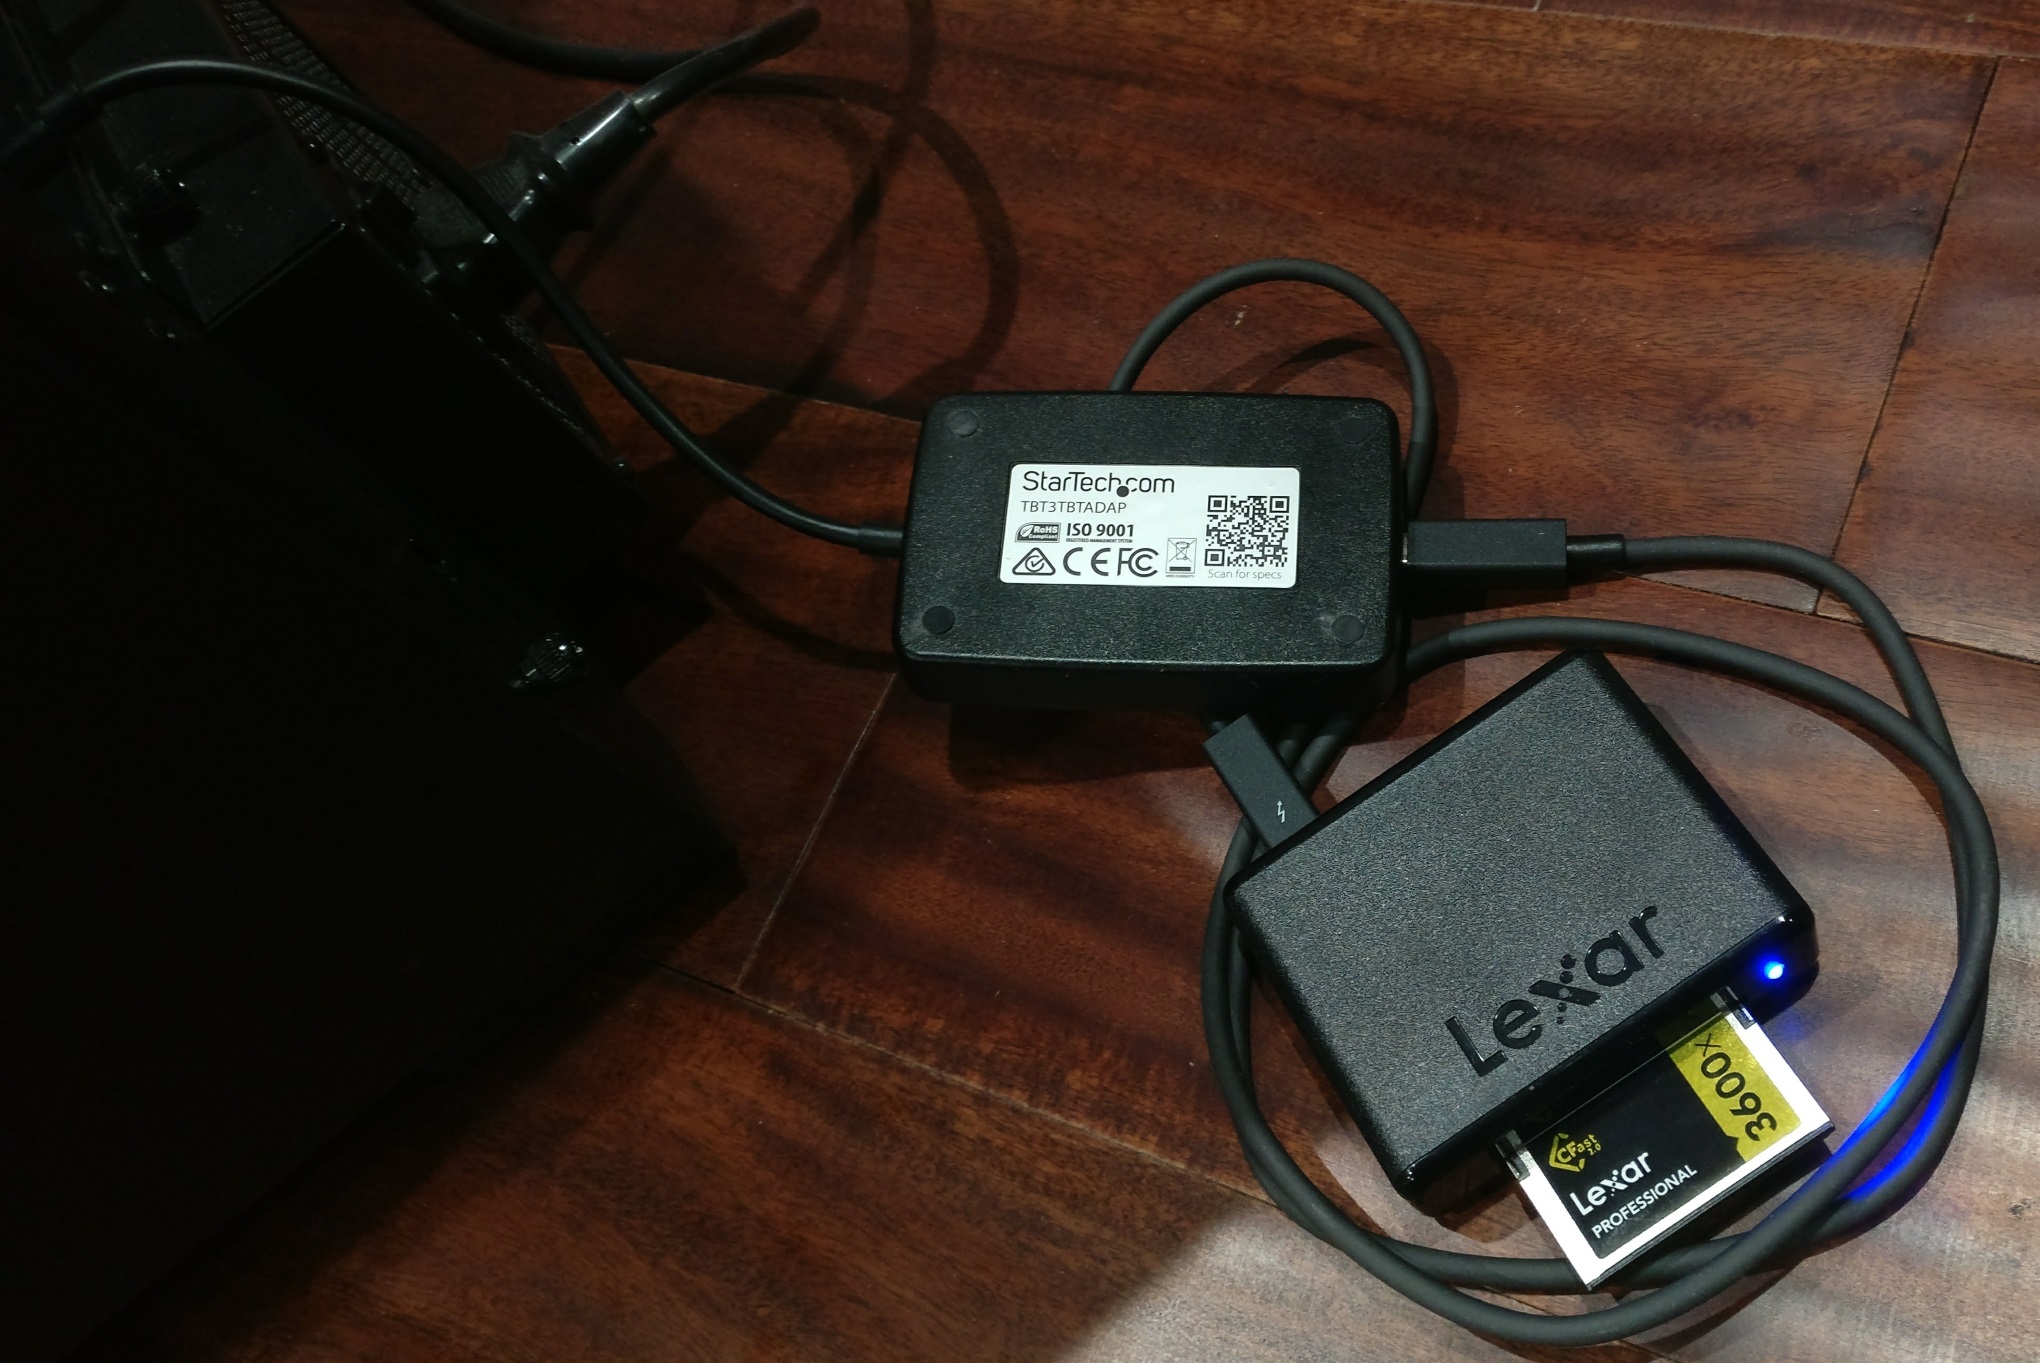
All the tests were carried out using the Thunderbolt 3 / USB 3.1 Gen 2 Type-C port in the system (enabled by the Alpine Ridge controller). Basic operation was tested out using all combinations of interfaces available in the HR2 hub - USB 3.0 via a Type-C male to Type-A female cable, and, Thunderbolt 2 using a StarTech.com Thunderbolt 3 to Thunderbolt adapter.
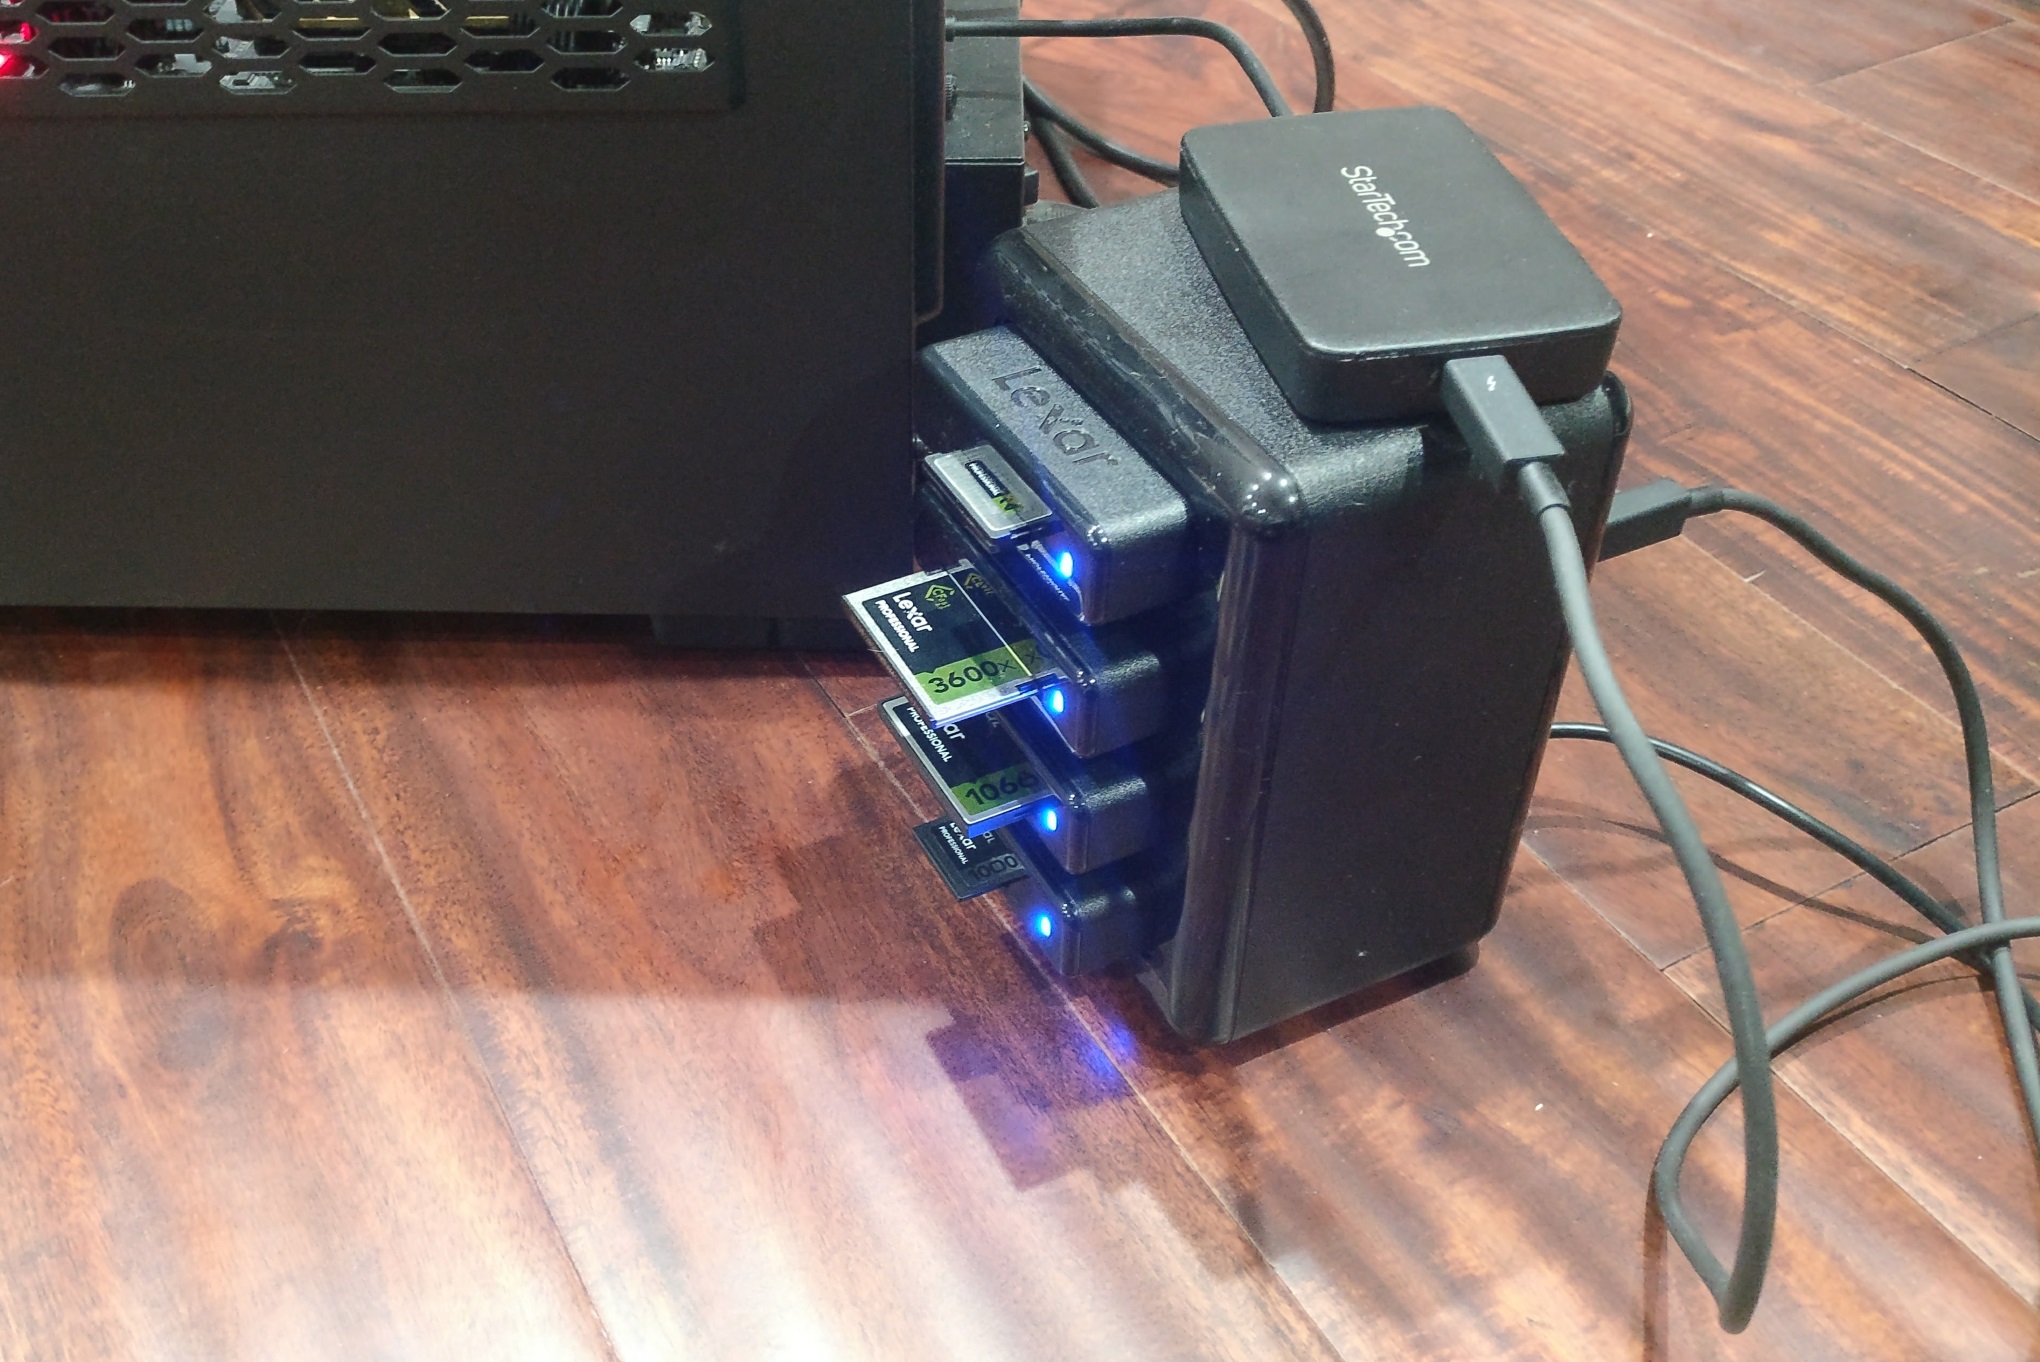
The performance evaluation used the readers in the hub via its USB 3.0 interface. However, for the CFast 2.0 reader, the Thunderbolt interface on the reader was directly used and the hub was taken out of the picture.
Our review workflow for memory cards test the following aspects.
- Sequential writes and reads (fresh pass)
- robocopy benchmarks (AnandTech DAS Suite) with performance consistency evaluation
- PCMark 8 Storage Bench (selected workloads)
- Sequential writes and reads (used pass)
- CrystalDiskMark sequential workloads (used and refreshed)
The justification for each of the tests and the details of how they are framed is discussed below.
The evaluation of memory cards need to go beyond the usual robocopy benchmarks with data of varying types because the primary use-case is very different. The workload in content capture devices is primarily sequential with a large block size. While the recording involves writes, the import process relies on sequential reads. Storage media usually perform way better (in terms of bandwidth) in sequential accesses compared to random small-sized accesses. Flash-based media is no different, but the challenge in sequential workloads is to maintain performance consistency over the full capacity of the drive when the accesses are sustained. In SSDs and USB thumb drives, we often see performance go down drastically once the SLC cache is filled up. This type of performance is dangerous for content capture devices in the field, as the last thing that photographers and videographers want is the memory card not being able to keep up with the data rate at which the recorded content is written. Since it is a real-time operation, hiccups on the card side tend to result in lost footage. Our first test involves a sequential write FIO [ http://bluestop.org/fio/ ] workload with a block size of 128K and one file open at a time. The workload size is set to 90% of the card capacity, with new files created every 2GB. The sequential write workload is followed by a sequential read of the same set of files with similar access parameters. Throughout this FIO test, the instantaneous write and read bandwidths to the card are recorded and graphed. This gives us a quick overview of the sustained bandwidth numbers for the card - in particular, readers need to note the valleys and ensure that the bitrate at which their camera records on to the card is never more than the minimum achieved write bandwidth.
The above test is followed up with our standard direct-attached storage benchmark. The first part involves transfer of each of the three folders below from a RAM drive in the testbed into the card and reading the data back. This process is repeated thrice for each folder, and the instantaneous bandwidth is graphed.
- Photos: 15.6 GB collection of 4320 photos (RAW as well as JPEGs) in 61 sub-folders
- Videos: 16.1 GB collection of 244 videos (MP4 as well as MOVs) in 6 sub-folders
- BR: 10.7 GB Blu-ray folder structure of the IDT Benchmark Blu-ray (the same that we use in our robocopy tests for NAS systems)
The intent behind this test is to determine if higher queue depths that still correspond to valid real-world use-cases can extract more performance out of the card compared to our primary use-case test. It also serves as a starting point for simulating extended usage of the card.
The second part of our standard DAS benchmark is Futuremark's PCMark 8 Storage Bench. The storage workload involves games as well as multimedia editing applications - this goes well with the microSD use-cases in mobile devices and embedded systems (and the reason for the introduction of the application performance class ratings). The command line version allows us to cherry-pick storage traces to run on a target drive. We chose the following traces.
- Adobe Photoshop (Light)
- Adobe Photoshop (Heavy)
- Adobe After Effects
- Adobe Illustrator
Usually, PC Mark 8 reports time to complete the trace, but the detailed log report has the read and write bandwidth figures which we present in our performance graphs. Note that the bandwidth number reported in the results don't involve idle time compression. In addition, the storage bench also preconditions the storage device. The whole process provides some interesting bandwidth numbers and also simulates extended usage of the card.
The FIO benchmarks are again repeated at this stage to get an idea of the performance degradation after extended usage. Finally, we run CrystalDiskMark's default sequential workloads in the same state to gather some numbers instead of inferring them from the graph alone. We try to then restore the card to its original performance state (method varies from one card type to another) and check if there is any improvement in the CrystalDiskMark numbers.
In addition to a qualitative and quantitative discussion of the performance numbers, pricing is also an important aspect. Each card being reviewed is compared on a $/GB metric to provide readers with a measure of the value proposition.


32 Comments
View All Comments
petteyg359 - Wednesday, June 28, 2017 - link
Looks like a huge massive gigantic other-repeated-words-for-big waste of space. I'll stick to my regular itty-bitty USB hubs and readers that are barely larger than the Flash cards.StrangerGuy - Sunday, July 2, 2017 - link
I'll stick with my $82 Xiaomi USB SD card reader that also happens to have a 5" screen, octacore A53, 2GB of RAM, 4100mAH UPS and can make phone calls.