The Crucial P1 1TB SSD Review: The Other Consumer QLC SSD
by Billy Tallis on November 8, 2018 9:00 AM ESTBAPCo SYSmark 2018
BAPCo's SYSmark 2018 is an application-based benchmark that uses real-world applications to replay usage patterns of business users, with subscores for productivity, creativity and responsiveness. Scores represnt overall system performance and are calibrated against a reference system that is defined to score 1000 in each of the scenarios. A score of, say, 2000, would imply that the system under test is twice as fast as the reference system.
SYSmark scores are based on total application response time as seen by the user, including not only storage latency but time spent by the processor. This means there's a limit to how much a storage improvement could possibly increase scores, because the SSD is only in use for a small fraction of the total test duration. This is a significant difference from our ATSB tests where only the storage portion of the workload is replicated and disk idle times are cut short to a maximum of 25ms.
| AnandTech SYSmark SSD Testbed | |
| CPU | Intel Core i5-7400 |
| Motherboard | ASUS PRIME Z270-A |
| Chipset | Intel Z270 |
| Memory | 2x 8GB Corsair Vengeance DDR4-2400 CL17 |
| Case | In Win C583 |
| Power Supply | Cooler Master G550M |
| OS | Windows 10 64-bit, version 1803 |
Our SSD testing with SYSmark uses a different test system than the rest of our SSD tests. This machine is set up to measure total system power consumption rather than just the drive's power. The test is run five times in a row on each hardware configuration, and the average scores are reported below.
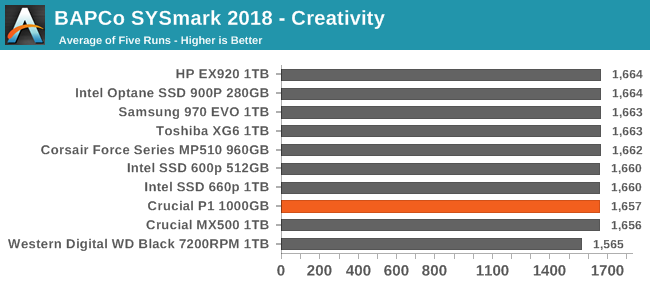
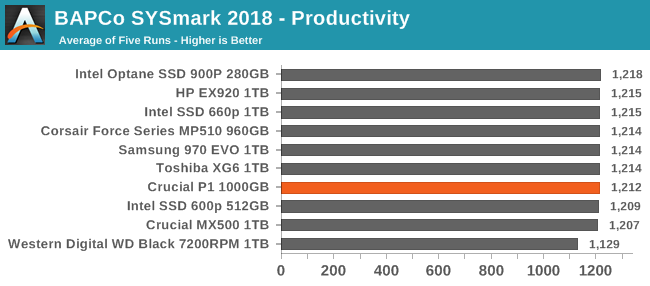
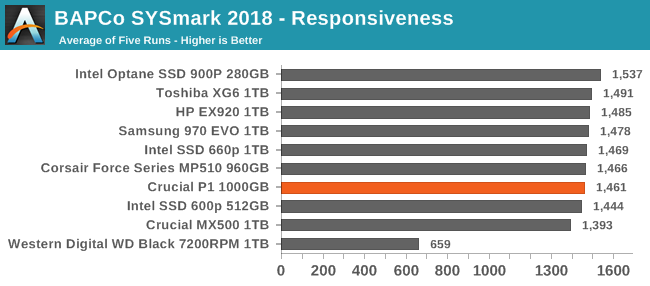
The creativity and productivity scenarios are relatively unaffected by storage performance, and depend much more on compute power. The responsiveness scores are more dependent on storage performance, but even so the differences between SSDs are fairly small. The Crucial P1 is outperforms the MX500 SATA drive but is a bit slower than the high-end NVMe drives.
Energy Usage
The SYSmark energy usage scores measure total system power consumption, excluding the display. Our SYSmark test system idles at around 26 W and peaks at over 60 W measured at the wall during the benchmark run. SATA SSDs seldom exceed 5 W and idle at a fraction of a watt, and the SSDs spend most of the test idle. This means the energy usage scores will inevitably be very close. A typical notebook system will tend to be better optimized for power efficiency than this desktop system, so the SSD would account for a much larger portion of the total and the score difference between SSDs would be more noticeable.
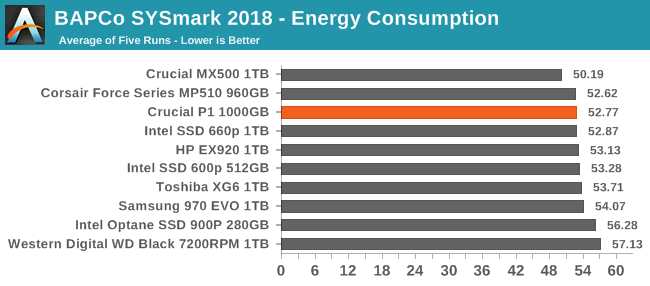
The energy consumption scores for the SSDs reflect the general trend that higher performance comes with the cost of worse power efficiency. SATA SSDs still lead the rankings for most efficient drive, and the hard drive that's included for comparison purposes required more energy than even the power-hungry Intel Optane SSD 900P.


66 Comments
View All Comments
DigitalFreak - Thursday, November 8, 2018 - link
At this rate, by the time they get to H(ex)LC you'll only be able to write 1GB per day to your drive or risk having it fail.PeachNCream - Thursday, November 8, 2018 - link
Please don't give them any ideas! The last thing we need is NAND that generously handles a few dozen P/E cycles before dying. We've already gone from millions of P/E cycles to a few hundred in the last 15 years and data retention has dropped from over a decade to under six months. Sure you can get a lot more capacity for the price, but NAND needs to be replaced with something more durable sooner rather than later. (And no, I'm not advocating for Optane either, just something that lasts longer and has room for density improvements - don't care what that something is.)MrCommunistGen - Thursday, November 8, 2018 - link
I was expecting the extra DRAM to provide a more meaningful advantage over the Intel 660p... I guess it makes sense that Intel left it off to save on BOM.Ratman6161 - Thursday, November 8, 2018 - link
This could be a very good standard desktop drive if 1) the price is right and 2) you can accept that the 1 TB drive is really only good for up to 900 GB. You would just partition the drive such that there is 100 GB free (or make sure you always just keep that much space free) so you always have the maximum SLC cach available. For the price to be right, it has to be lower. Taking the prices from the article, the 1 TB P1 is only $8 cheaper than a 970 EVO. Now if they could get the price down to the same territory as the current MX 500 they might have something.Billy Tallis - Thursday, November 8, 2018 - link
Leaving 10% of the drive unpartitioned won't be enough to get the maximum size SLC cache, because 1GB of SLC cache requires 4GB of QLC to be used as SLC. However, 10% manual overprovisioning would definitely reduce the already small chances of overflowing the SLC cache.mczak - Thursday, November 8, 2018 - link
On that note, wouldn't it actually make sense to use a MLC cache instead of a SLC cache for these SSDs using QLC flash (and by MLC of course I mean using 2 bits per cell)? I'd assume you should still be able to get very decent write speeds with that, and it would effectively only need half as much flash for the same cache size.Billy Tallis - Thursday, November 8, 2018 - link
Cache size isn't really a big enough problem for a 2bpc MLC write cache to be worthwhile. Using SLC for the write cache has several advantages: highest performance/lowest latency, single-pass reads and writes (important for Crucial's power loss immunity features), and your SLC cache can use flash blocks that are too worn out to still reliably store multiple bits per cell. A slower write cache with twice the capacity would only make sense if consumer workloads regularly overflowed the existing write cache. Almost all of the instances where our benchmarks overflow SLC caches are a consequence of our tests giving the drive less idle time than real-world usage, rather than being tests representing use cases where the cache would be expected to overflow even in the real world.idri - Thursday, November 8, 2018 - link
Why don't you guys include the Samsung 970 PRO 1TB in your charts for comparison? It's one of the most sought after SSDs on the market for HEDT systems and for sure it would be useful to have your tests results for this one too. Thanks.Billy Tallis - Thursday, November 8, 2018 - link
A.) Samsung didn't send me a 970 PRO. B.) The 970 PRO is pretty far outside the range of what could be considered competition for an entry-level NVMe SSD. It's a drive you buy for bragging rights, not for real-world performance benefits. The Optane SSD is in that same category, and I don't think the graphs for this kind of review need to be cluttered up with too many of those.PeachNCream - Thursday, November 8, 2018 - link
Not to be obtuse, but by price the 970 PRO is well within the range of competition for the P1 given that the 1TB 970 retails for $228 on Amazon right now and the MSRP for the 1TB P1 $220. Buyers looking for a product will most certainly consider the $8 difference and factor that into their decision to move up from an entry-level product to a "bragging rights" option given the insignificant difference in cost. Your first point is valid. I would have stopped there since its reasonable to say, "Physically impossible, don't have one there pal."