The AMD Ryzen 5 2500X and Ryzen 3 2300X CPU Review
by Ian Cutress on February 11, 2019 11:45 AM ESTCPU Performance: System Tests
Our System Test section focuses significantly on real-world testing, user experience, with a slight nod to throughput. In this section we cover application loading time, image processing, simple scientific physics, emulation, neural simulation, optimized compute, and 3D model development, with a combination of readily available and custom software. For some of these tests, the bigger suites such as PCMark do cover them (we publish those values in our office section), although multiple perspectives is always beneficial. In all our tests we will explain in-depth what is being tested, and how we are testing.
All of our benchmark results can also be found in our benchmark engine, Bench.
Application Load: GIMP 2.10.4
One of the most important aspects about user experience and workflow is how fast does a system respond. A good test of this is to see how long it takes for an application to load. Most applications these days, when on an SSD, load fairly instantly, however some office tools require asset pre-loading before being available. Most operating systems employ caching as well, so when certain software is loaded repeatedly (web browser, office tools), then can be initialized much quicker.
In our last suite, we tested how long it took to load a large PDF in Adobe Acrobat. Unfortunately this test was a nightmare to program for, and didn’t transfer over to Win10 RS3 easily. In the meantime we discovered an application that can automate this test, and we put it up against GIMP, a popular free open-source online photo editing tool, and the major alternative to Adobe Photoshop. We set it to load a large 50MB design template, and perform the load 10 times with 10 seconds in-between each. Due to caching, the first 3-5 results are often slower than the rest, and time to cache can be inconsistent, we take the average of the last five results to show CPU processing on cached loading.
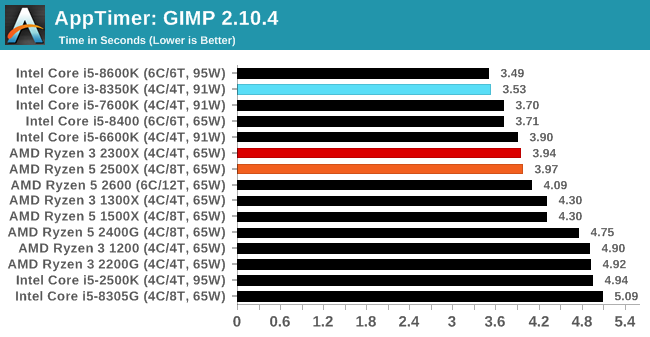
Loading a program is usually a single threaded issue, and the Intel chips do well here. Our two AMD chips turbo to the same frequency, so they score roughly the same.
FCAT: Image Processing
The FCAT software was developed to help detect microstuttering, dropped frames, and run frames in graphics benchmarks when two accelerators were paired together to render a scene. Due to game engines and graphics drivers, not all GPU combinations performed ideally, which led to this software fixing colors to each rendered frame and dynamic raw recording of the data using a video capture device.
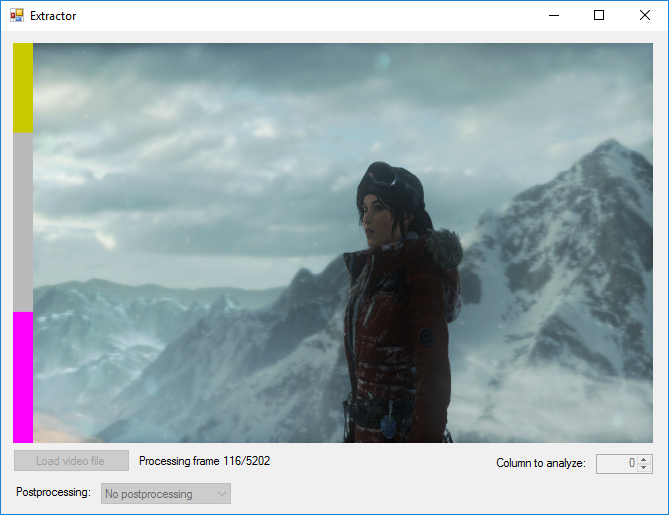
The FCAT software takes that recorded video, which in our case is 90 seconds of a 1440p run of Rise of the Tomb Raider, and processes that color data into frame time data so the system can plot an ‘observed’ frame rate, and correlate that to the power consumption of the accelerators. This test, by virtue of how quickly it was put together, is single threaded. We run the process and report the time to completion.
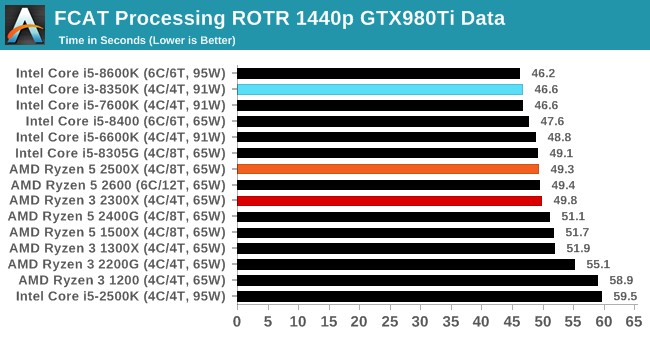
FCAT is single thread driven, and so the Intel chips do well here as well. The 2500X is beating the 2300X, just, as they both turbo to the same amount.
3D Particle Movement v2.1: Brownian Motion
Our 3DPM test is a custom built benchmark designed to simulate six different particle movement algorithms of points in a 3D space. The algorithms were developed as part of my PhD., and while ultimately perform best on a GPU, provide a good idea on how instruction streams are interpreted by different microarchitectures.
A key part of the algorithms is the random number generation – we use relatively fast generation which ends up implementing dependency chains in the code. The upgrade over the naïve first version of this code solved for false sharing in the caches, a major bottleneck. We are also looking at AVX2 and AVX512 versions of this benchmark for future reviews.
For this test, we run a stock particle set over the six algorithms for 20 seconds apiece, with 10 second pauses, and report the total rate of particle movement, in millions of operations (movements) per second. We have a non-AVX version and an AVX version, with the latter implementing AVX512 and AVX2 where possible.
3DPM v2.1 can be downloaded from our server: 3DPMv2.1.rar (13.0 MB)
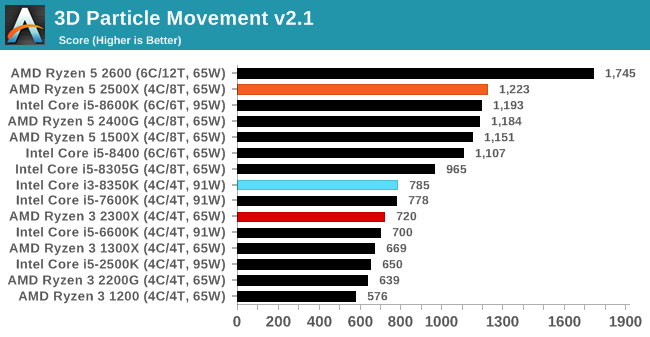
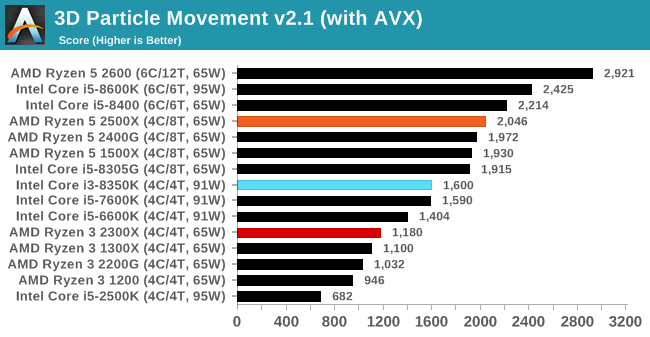
With more threads, the 2500X steams ahead, although it is worth noting that without AVX, the 2300X and 8350K are relatively close, but the gap widens when we add AVX2 to the mix. The Intel chip actually more than doubles its performance, whereas AMD gets around 50% more.
Dolphin 5.0: Console Emulation
One of the popular requested tests in our suite is to do with console emulation. Being able to pick up a game from an older system and run it as expected depends on the overhead of the emulator: it takes a significantly more powerful x86 system to be able to accurately emulate an older non-x86 console, especially if code for that console was made to abuse certain physical bugs in the hardware.
For our test, we use the popular Dolphin emulation software, and run a compute project through it to determine how close to a standard console system our processors can emulate. In this test, a Nintendo Wii would take around 1050 seconds.
The latest version of Dolphin can be downloaded from https://dolphin-emu.org/
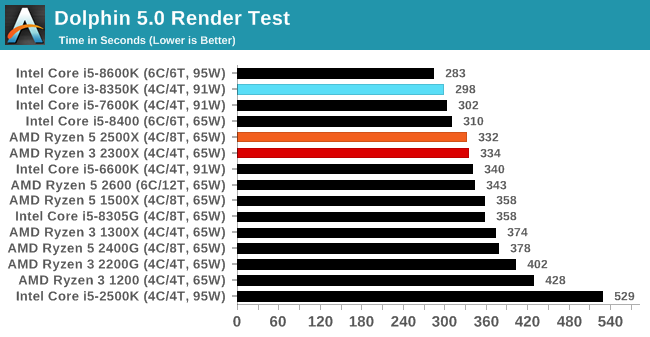
Dolphin is very single thread driven, and so the Intel chips win again, with both of our AMD CPUs scoring roughly the same.
DigiCortex 1.20: Sea Slug Brain Simulation
This benchmark was originally designed for simulation and visualization of neuron and synapse activity, as is commonly found in the brain. The software comes with a variety of benchmark modes, and we take the small benchmark which runs a 32k neuron / 1.8B synapse simulation, equivalent to a Sea Slug.
Example of a 2.1B neuron simulation
We report the results as the ability to simulate the data as a fraction of real-time, so anything above a ‘one’ is suitable for real-time work. Out of the two modes, a ‘non-firing’ mode which is DRAM heavy and a ‘firing’ mode which has CPU work, we choose the latter. Despite this, the benchmark is still affected by DRAM speed a fair amount.
DigiCortex can be downloaded from http://www.digicortex.net/
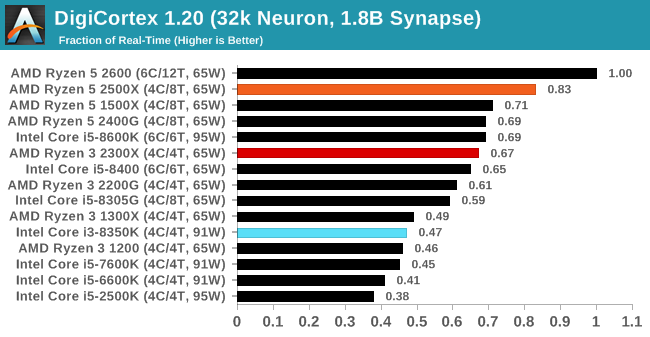
When it comes to Digi-Cortex, the AMD CPUs have the upper hand here. Both the 2500X and 2300X crush most of the Intel chips, helped a lot by their higher supported memory frequency.
y-Cruncher v0.7.6: Microarchitecture Optimized Compute
I’ve known about y-Cruncher for a while, as a tool to help compute various mathematical constants, but it wasn’t until I began talking with its developer, Alex Yee, a researcher from NWU and now software optimization developer, that I realized that he has optimized the software like crazy to get the best performance. Naturally, any simulation that can take 20+ days can benefit from a 1% performance increase! Alex started y-cruncher as a high-school project, but it is now at a state where Alex is keeping it up to date to take advantage of the latest instruction sets before they are even made available in hardware.
For our test we run y-cruncher v0.7.6 through all the different optimized variants of the binary, single threaded and multi-threaded, including the AVX-512 optimized binaries. The test is to calculate 250m digits of Pi, and we use the single threaded and multi-threaded versions of this test.
Users can download y-cruncher from Alex’s website: http://www.numberworld.org/y-cruncher/
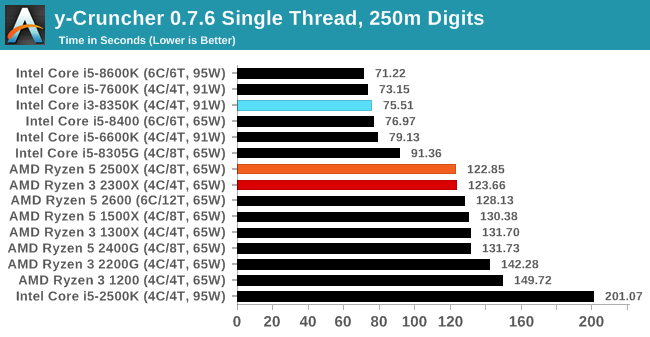
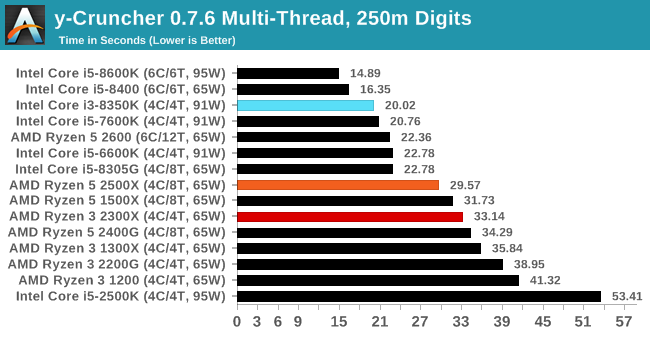
Intel's strong AVX2 performance shows in our y-Cruncher tests.
Agisoft Photoscan 1.3.3: 2D Image to 3D Model Conversion
One of the ISVs that we have worked with for a number of years is Agisoft, who develop software called PhotoScan that transforms a number of 2D images into a 3D model. This is an important tool in model development and archiving, and relies on a number of single threaded and multi-threaded algorithms to go from one side of the computation to the other.
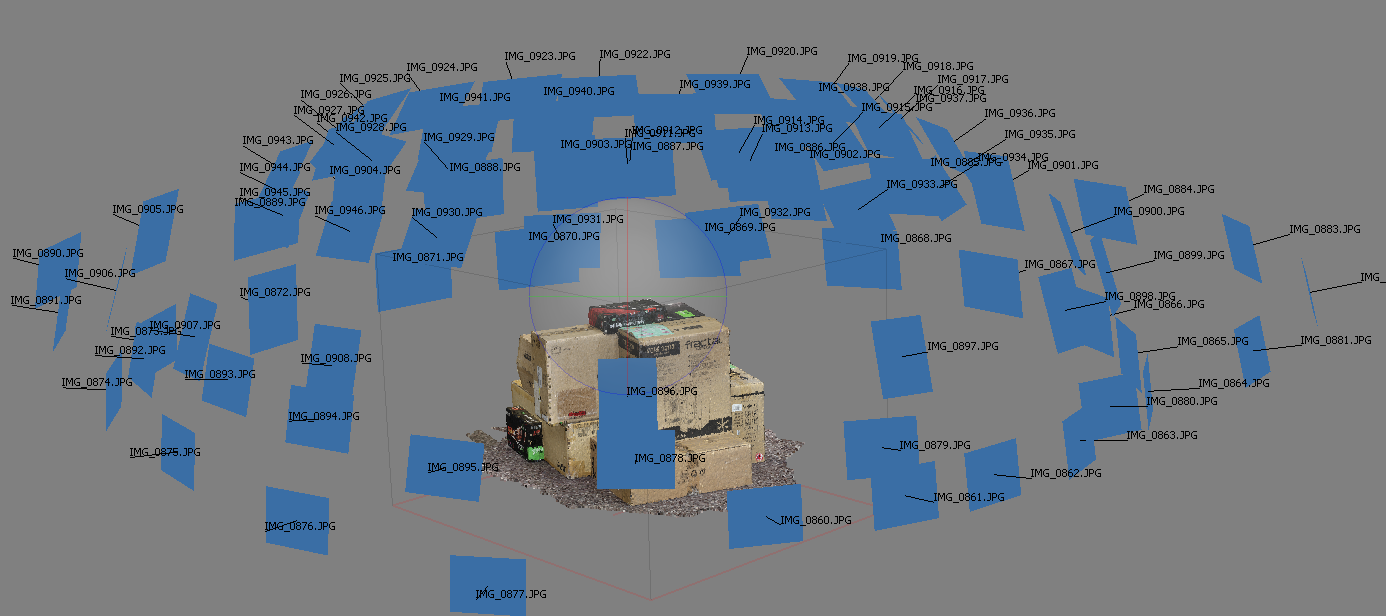
In our test, we take v1.3.3 of the software with a good sized data set of 84 x 18 megapixel photos and push it through a reasonably fast variant of the algorithms, but is still more stringent than our 2017 test. We report the total time to complete the process.
Agisoft’s Photoscan website can be found here: http://www.agisoft.com/
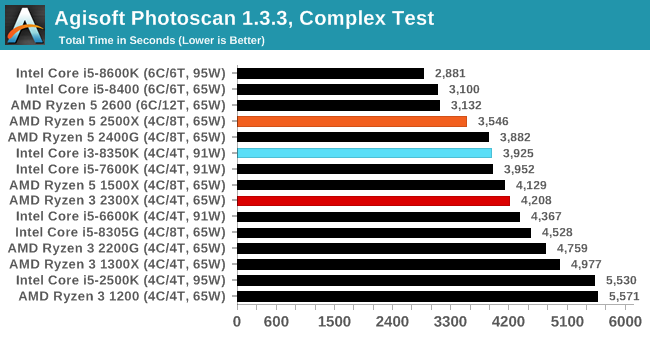
Agisoft likes a mix of threads and IPC, and the Intel CPU sits between our quad-core and quad-core with simultaneous multithreading AMD CPUs. Moving up to the 2600 from the 2500X gives a reasonable 10%+ gain in performance.


65 Comments
View All Comments
Korguz - Tuesday, February 12, 2019 - link
keep in mind Pajuk, the prices Anandtech quotes.. are US dollars i think..Karthick7 - Monday, February 11, 2019 - link
This has eventually encouraged a lot of others <a href="https://hosting-india.in/best-java-hosting-india/&... WordPress Hosting India</a> to look forward to starting their own WordPress websites.Ej24 - Tuesday, February 12, 2019 - link
Really would have liked to have seen more Intel 4c/4t and 4c/8t cpu's for comparison, like 4690k, 6700k or 7700k. I'm curious how my 4790k stacks up to amds zen+ 4c/8t cpu but from the others tested its hard to say.Rudde - Tuesday, February 12, 2019 - link
Visit bench?BlackSwan - Tuesday, February 12, 2019 - link
This OEM version is already available for retail purchase here in Russiahttps://www.regard.ru/catalog/tovar304279.htm?ymcl...
BlackSwan - Tuesday, February 12, 2019 - link
https://www.regard.ru/catalog/tovar304288.htm2700е
The_Assimilator - Tuesday, February 12, 2019 - link
AMD's CPU naming scheme is a bit of a mess now. Used to be that Ryzen 7 = 8c/16t, 5 = 6c/12t, 3 = 4c/4t but now we have 4c/8t parts mucking up the 5s. IMO they should reorder their lineup by core and thread counts by moving current Ryzen 3 to 1, and 4c/8t CPUs from Ryzen 5 to 3.End result: Ryzen 7 = 2700/X, Ryzen 5 = 2600/X, Ryzen 3 = 2500X/2400G, Ryzen 1 = 2300X/2200G.
silverblue - Tuesday, February 12, 2019 - link
Not really, given that the Ryzen 5 1400 and Ryzen 5 1500X are 4C/8T parts from just after the initial Ryzen launch, so in essence it was messed up to begin with. Also, if we're splitting hairs, Intel used to have HT in its i3 and i7 CPUs...Smell This - Tuesday, February 12, 2019 - link
Yeah.Chipzilla's naming scheme and product stack is The Greatest . . . (rolling eyes)
The_Assimilator - Tuesday, February 12, 2019 - link
We don't talk about Intel's lineup and naming scheme... or lack thereof. Down that path lies madness.