Smartphone Audio Quality Testing
by Chris Heinonen on December 8, 2013 5:15 PM EST- Posted in
- Smartphones
- Audio
- Mobile
- Tablets
- Testing
Maximum Level
The maximum output level is derived from the 1kHz test tone used to determine THD+N. The higher the output from the headphone jack, the louder it can drive a pair of headphones. More importantly, having more power available means when you have dynamic music passages that call for power you are less likely to clip the waveform.
There is no chart to show here, just a number that the Audio Precision gives us. In our test data, the most powerful phone was the iPhone 5, at 32.46 mW of power. Next is the Nexus 5 at 22.24 mW, though we can’t drive it that high. Then the Note 3 at 11.81 mW and finally the Galaxy S4 at 3.895 mW. Doubling the power, from 4 mW to 8 mW, produces a 3 dB increase in volume level. 3 dB is the smallest change in volume levels we can easily hear. So even though the iPhone 5 produces 32 mW vs. 4 mW, that is only a 9 dB difference in volume. 10 dB is doubling the volume, so it isn’t even twice as loud. If you have demanding headphones, you will want as much power as you can get.
Frequency Response
To measure the frequency response we measure a set of 61 tones from 20 Hz to 20 kHz. All of these are then equalized to 1 kHz so we can see the maximum deviation from that level. An ideal phone will be perfectly flat here and allow you to adjust this with an EQ setting, or though your taste in headphones. On this test our best performing phone is the Galaxy S4, as seen here.
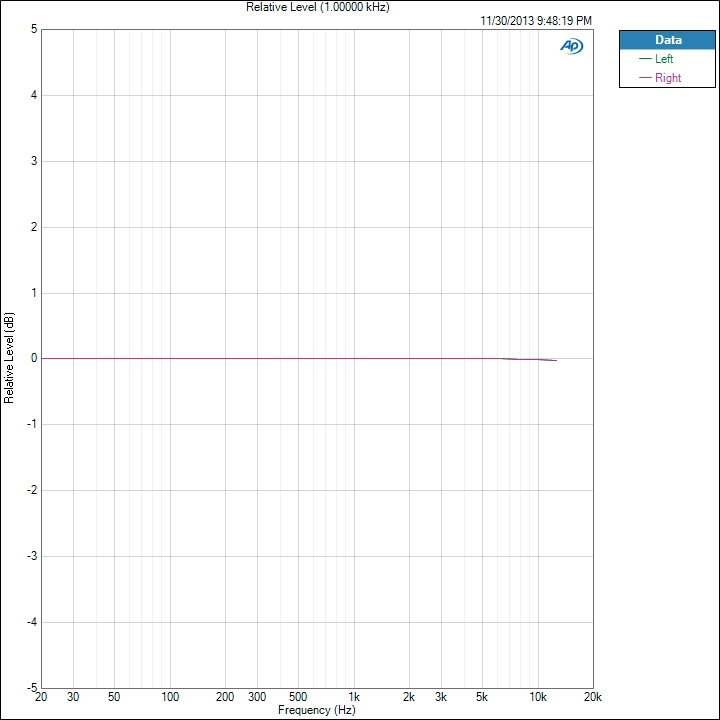
The total variation from 1 kHz is only 0.014 dB which is very good. The worst performing phone is the iPhone 5, but its variation is only 0.089 dB.
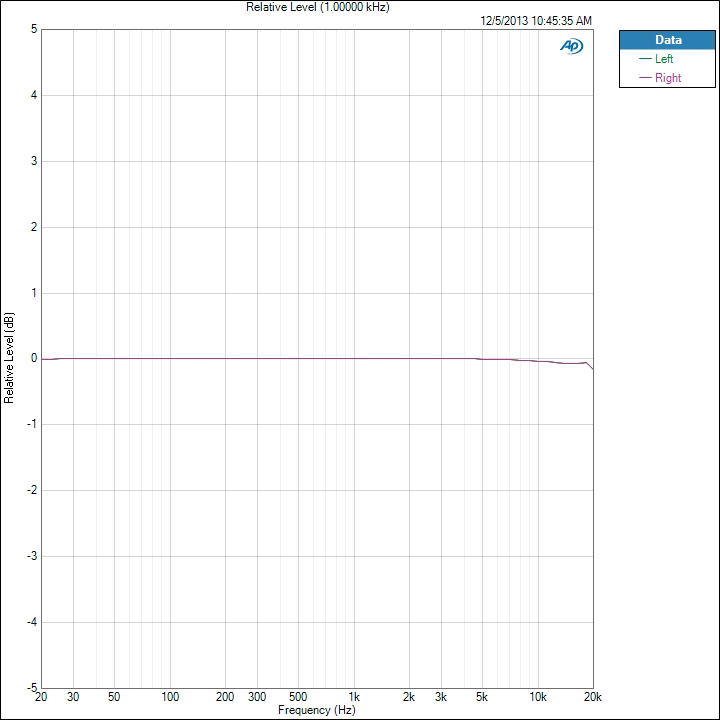
The iPhone 5 also picked up the 20 kHz tone while the Samsung and many others missed it. If we dropped this tone then it might be just as flat. The iPhone 5 test was run slightly differently, as it can't run the Android test program, which might account for this. For a phone with a different response, here is the HTC One with Beats enabled. Other HTC One testing is still in progress as I write this article.
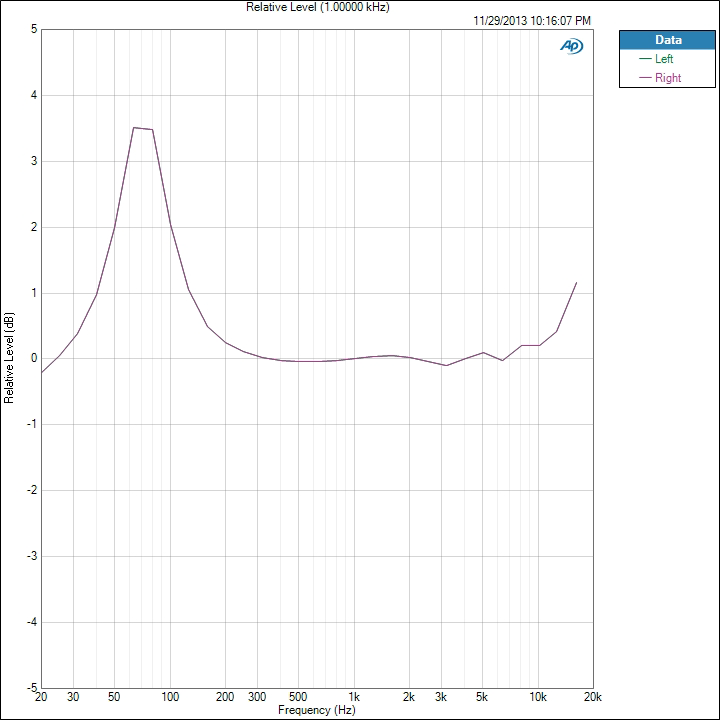
Here we see that Beats is adding a +3.5 dB boost from 60 Hz to 90 Hz, but the deviation from 0 dB goes from 30Hz to 300 Hz. Past 6.5 kHz we also see a rise in the treble. People often mistake boosted treble for extra detail, which is likely the reasoning behind this. As we see it is far different than the other two examples we looked at.


188 Comments
View All Comments
brusselwilson - Sunday, December 8, 2013 - link
Is sample variation an issue of relevance for smartphone audio systems?cheinonen - Sunday, December 8, 2013 - link
No more than it would be with anything else I would think. For the Nexus 5 I tested two different samples (one from Brian, one from a friend of mine) and both exhibited this issue. So you might see small variations, as you would with any display or anything else, but nothing major I wouldn't think.vailr - Sunday, December 8, 2013 - link
Another factor to consider: certain cell companies can enable enhanced audio quality for cell phone calls, but only on selected cell phone models. The IPhone 5 has that ability, as I recall. Not sure about the specifics, but I believe that both ends of the cell call must be using supported phones, as well as: the cell provider must enable that feature. That would enable cell calls to have better voice quality than land line calls, via increased audio frequency response.shenkey - Sunday, December 8, 2013 - link
Could we also get Windows Phone devices included in the test. Lumia 920 and 1520 should fit in the range.cheinonen - Sunday, December 8, 2013 - link
I'll add whatever I can when I get a chance. This first run has taken almost all my time up since the week of Thanksgiving.hopfenspergerj - Sunday, December 8, 2013 - link
It's not useful to measure noise/dynamic range at the highest volume setting. You have to measure at one of the lowest settings to determine whether the phone truncates bits, whether the noise floor does not decrease with the volume setting, etc.I have an htc dna and it is completely, totally, utterly useless for playing music with sensitive IEMs; I suspect many android phones with "-90db" thd+n measurements are similarly bad in practice.
hopfenspergerj - Sunday, December 8, 2013 - link
Not to mention poor shielding on the dna causes the phone to output chirping and static and other loud extraneous noises whenever it transmits data.cheinonen - Sunday, December 8, 2013 - link
We have stepped output level charts as well that measure this, they just aren't included here right now. I can start to pull those out for current and future tests if we want to use them.evonitzer - Monday, December 9, 2013 - link
I saw that one graph included when you compared the Nexus 5 and G2 at different levels and I think it should be in all the reviews. I always run my IEM's in the lower half of the volume range so I am quite interested in how they perform. As others have said, excellent work!DoctorG - Tuesday, December 10, 2013 - link
Same here -- I always run my good IEM's below half volume at least (usually more like a third.) No point in having good headphones & music if the volume is turned up so loud it hurts....BTW Great job Chris! I have always wanted more in-depth reviews about smartphone audio quality. It's very important to me, but so far there haven't been any reliable/objective tests available. Thanks! Just a thought, but maybe it would be possible to test against a pro-quality amp/DAC? When I use my GNex, the quality is obviously very different from my audio interface that I use with ProTools. It'd be interesting to see just how much of that is measurable...