The Intel Broadwell Desktop Review: Core i7-5775C and Core i5-5675C Tested (Part 1)
by Ian Cutress on June 2, 2015 7:45 AM ESTTest Setup
As we mentioned in our introduction, Intel's 9-series chipset were designed from the start to allow future compatibility with Broadwell. As a result with a BIOS update we're able to drop these processors into our existing MSI and ASUS Z97 boards, though not without some pre-release BIOS teething issues.
| Test Setup | |
| Processor | Intel i7-5775C, 4C/8T Intel i5-5675C, 4C/4T |
| Motherboard | MSI Z97A Gaming 6 ASUS Z97 Pro |
| DRAM | G.Skill RipjawsZ 4x4GB DDR3-1866 C9 at DDR3-1600 |
| Low End GPU | Integrated ASUS R7 240 2GB DDR3 Dual Graphics with R7 240 |
| Mid Range GPU | MSI R9 285 Gaming 2GB MSI GTX 770 Lightning 2GB |
| High End GPU | MSI R9 290X Gaming LE 4GB ASUS GTX 980 Strix 4GB |
| Power Supply | OCZ 1250W Gold |
| Storage Drive | Crucial MX200 1TB |
| Operating System | Windows 7.1 64-bit, Build 7601 |
| CPU Cooler | Cooler Master Nepton 140XL CLC |
Many thanks to...
We must thank the following companies for kindly providing hardware for our test bed:
Thank you to AMD for providing us with the R9 290X 4GB GPUs.
Thank you to ASUS for providing us with GTX 980 Strix GPUs and the R7 240 DDR3 GPU.
Thank you to ASRock and ASUS for providing us with some IO testing kit.
Thank you to Cooler Master for providing us with Nepton 140XL CLCs.
Thank you to Corsair for providing us with an AX1200i PSU.
Thank you to Crucial for providing us with MX200 SSDs.
Thank you to G.Skill and Corsair for providing us with memory.
Thank you to MSI for providing us with the GTX 770 Lightning GPUs.
Thank you to OCZ for providing us with PSUs.
Thank you to Rosewill for providing us with PSUs and RK-9100 keyboards.
Load Delta Power Consumption
We'll start things off with a look at power consumption. Power consumption was tested on the system while in a single NVIDIA GTX 770 configuration with a wall meter connected to the OCZ 1250W power supply. This power supply is Gold rated, and as I am in the UK on a 230-240 V supply, leads to ~75% efficiency > 50W, and 90%+ efficiency at 250W, suitable for both idle and multi-GPU loading. This method of power reading allows us to compare the power management of the UEFI and the board to supply components with power under load, and includes typical PSU losses due to efficiency.
We are reporting the power consumption difference when idle and during an initial OCCT load. This is slightly skewed by the adjustment up the efficiency chain of our power supply, showing lower power CPUs consuming a little more, but despite this the qualitative comparison is a still a good place to start.
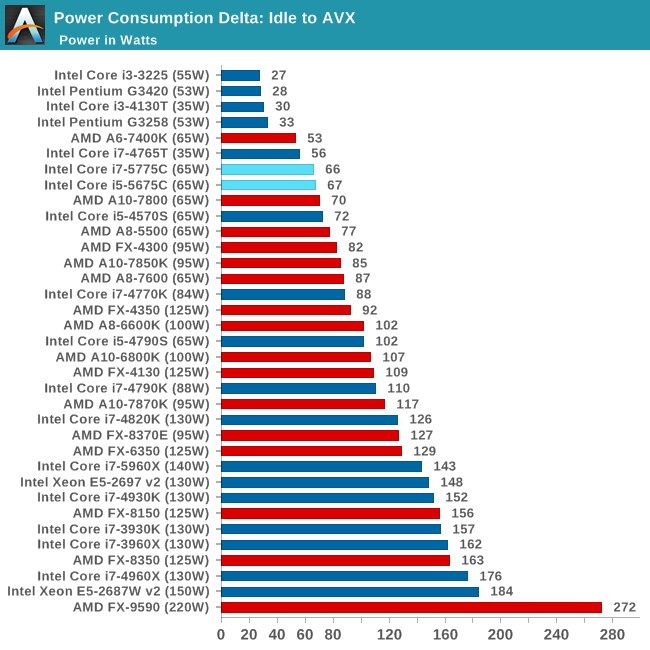
Despite our test being almost qualitative, it is exciting to see that in our power consumption limit test both CPUs score around their TDP values.


196 Comments
View All Comments
Pcorb - Tuesday, June 2, 2015 - link
I'm not so sure that high end desktop users are a large enough demographic that Intel will be complaining any time soon.yannigr2 - Wednesday, June 3, 2015 - link
Yes I am shouting that for a month now, but of course I was treated as an AMD brainless fanboy when pointing at that, so I must be wrong. Now we have a chart that it is misleading and hilarious at the same time. If Ian had done what is right and logical, those charts would have been informative, correct and fair. I think AMD created 7870K just to troll Ian's charts.Hulk - Tuesday, June 2, 2015 - link
It would be really nice if you would note the frequency each processor is running during each test. With all the turbos these days it's hard to know and therefore hard to make IPC comparisons.Mr Perfect - Tuesday, June 2, 2015 - link
Yes, please. Once upon a time, I would have had the clocks for all the models memorized, but without that comparing IPC is difficult to impossible without the clocks noted.MrSpadge - Tuesday, June 2, 2015 - link
+1Lonyo - Tuesday, June 2, 2015 - link
You state in the opening that if you upgrade on a 3 year cycle, you would be coming from SandyBridge. Would it not make sense to have some older Intel processors in the graphs?Ian Cutress - Tuesday, June 2, 2015 - link
With a recent new testing suite, we haven't gone back through enough generations yet with the new benchmarking scheme. You can still check legacy benchmarks (Cinebench 10 / POV-Ray) between old and new in Bench. www.anandtech.com/benchHulk - Tuesday, June 2, 2015 - link
Yes. One thing Anand did amazingly well was review the new Intel processors. Clock-normalized IPC comparisons from previous generations is really what we want to see. As well as normalized power consumption, ie energy used completing the same workload.mgilbert - Tuesday, June 2, 2015 - link
As a normal home PC user/gamer, I couldn't care less about small differences in power consumption. Sure, 100 Watts might matter, but what matters most to me is outright performance.Martin84a - Tuesday, June 2, 2015 - link
As a normal PC user/gamer, that's all I care about. Less heat and thus less noise. Having a passively cooled PC that never goes above 65C under load is pure bliss.