ADATA External and HP Portable SSDs Review: Featuring the ADATA SE800 and HP P700
by Ganesh T S on September 24, 2020 8:00 AM ESTSynthetic Benchmarks - ATTO and CrystalDiskMark
Most USB 3.1 Gen 2 drives with NVMe SSDs claim speeds of around 1000 MBps, and these are backed up by the ATTO benchmarks provided below. Unfortunately, these access traces are not very common in real-life scenarios.
| 1GBps-Class Drives Performance Benchmarks - ATTO |
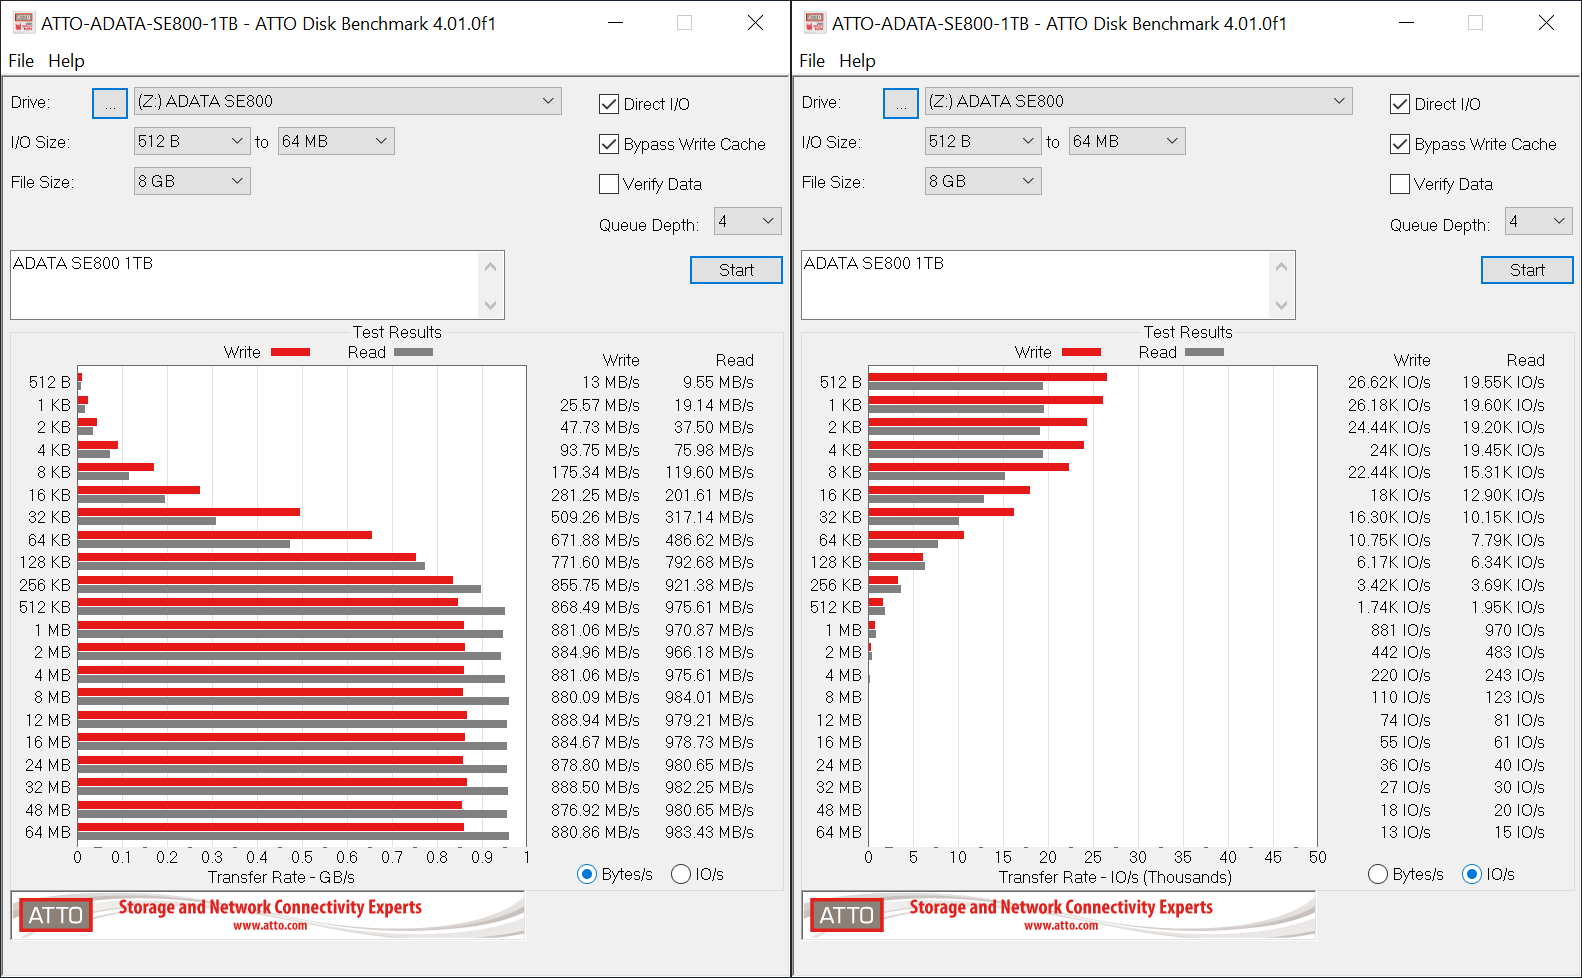 |
The reads for the ADATA SE800 and SE760, as well as the HP P700 come in at around 985 MBps, while the writes for the P700 win out at 955 MBps. The SE800 tops out at around 885 MBps, while the SE760 can reach only 780 MBps.
CrystalDiskMark, despite being a canned benchmark, provides a better estimate of the performance range with a selected set of numbers. As evident from the screenshot below, the performance can dip to as low as 14MBps for random 4K reads.
| 1GBps-Class Drives Performance Benchmarks - CrystalDiskMark |
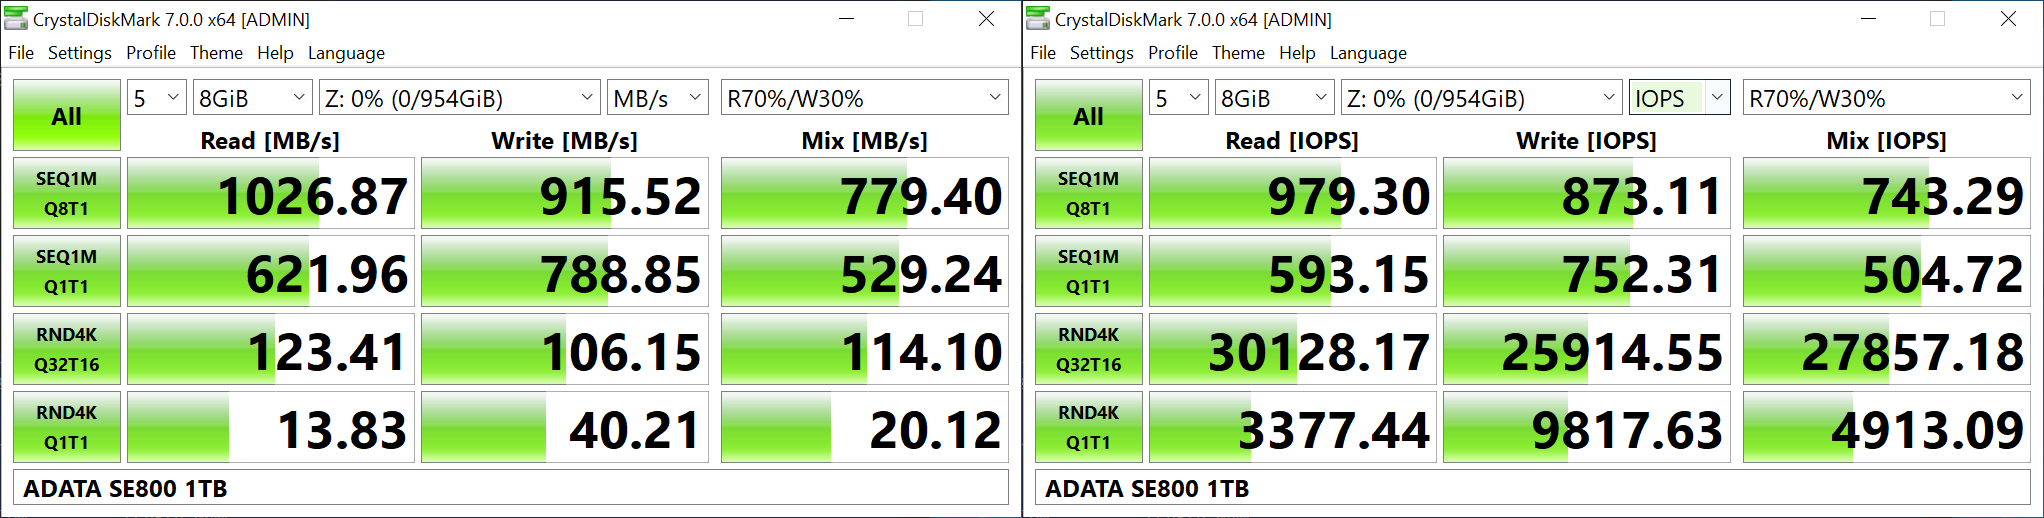 |
The HP P700 again comes out on top with a good balance of read and write speeds for the sequential access case that forms the bulk of typical DAS usage - 1030 MBps / 977 MBps, compared to the ADATA SE800's 1027 / 916 MBps and SE760's 1026 / 822 MBps.
SATA SSDs behind a USB 3.1 Gen 2 bridge claim speeds of around 550 MBps, while traditional USB flash controllers top out around 350 MBps. The ATTO benchmarks for the ADATA SC680, HP P600, and HP P500 provided below back up those claims.
| 500MBps-Class Drives Performance Benchmarks - ATTO |
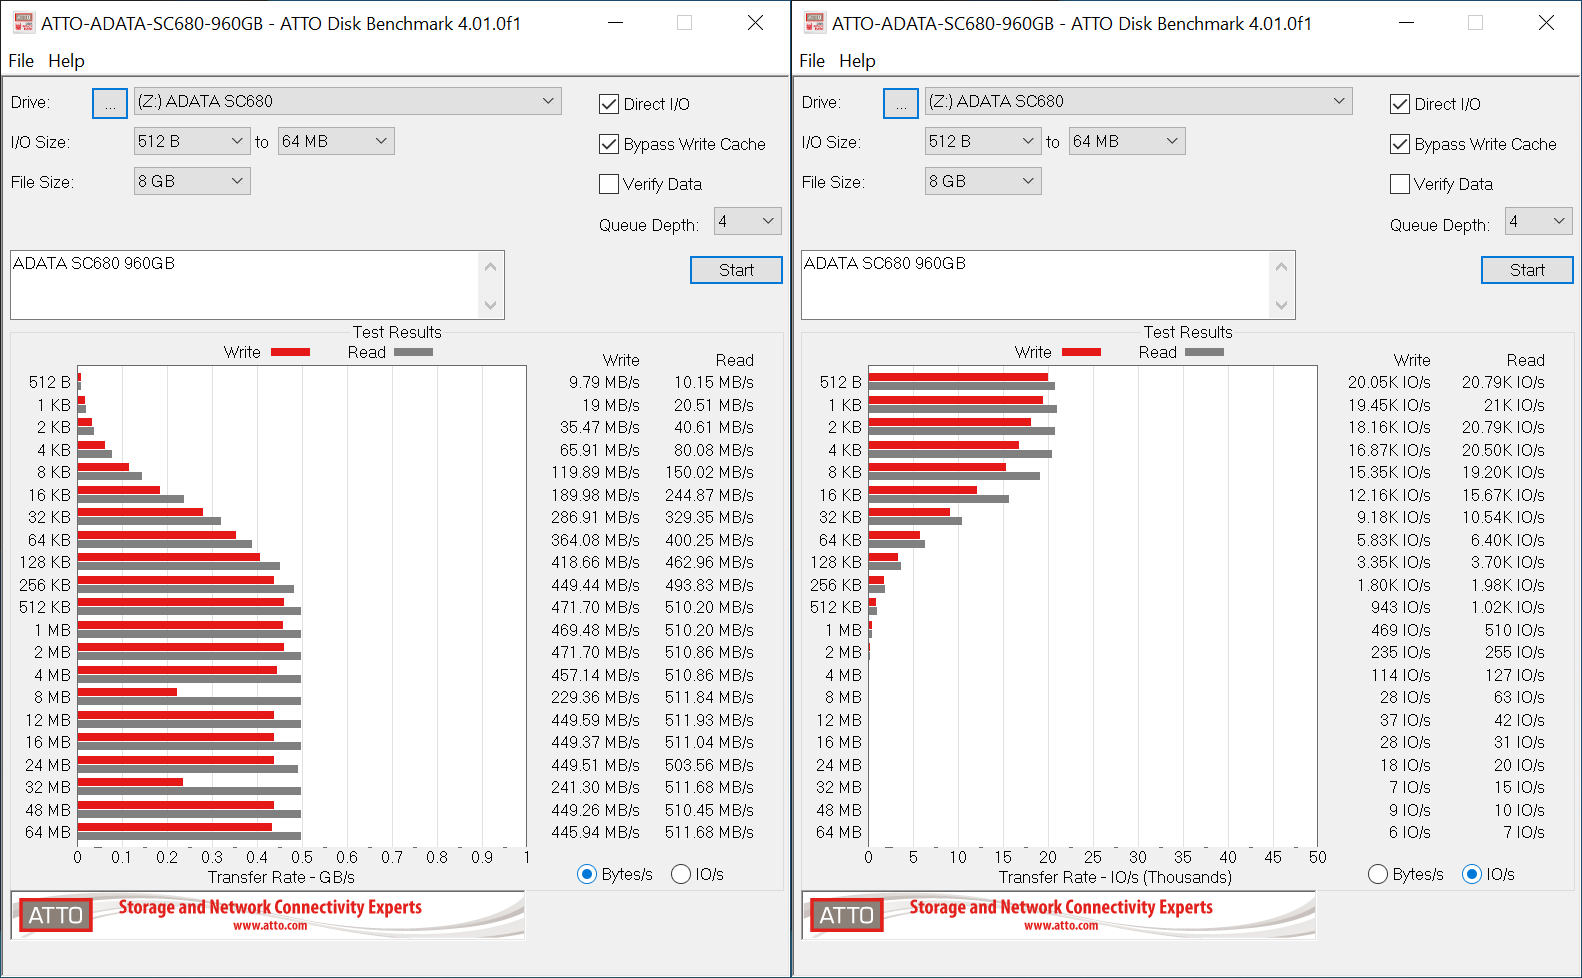 |
The HP P600 comes out on top by a fine margin in the ATTO numbers - 530 / 482 MBps, compared to the ADATA SC680's 512 / 472 MBps. The P500's 344 / 203 MBps numbers are not surprising given the USB flash controller in the device.
| 500MBps-Class Drives Performance Benchmarks - CrystalDiskMark |
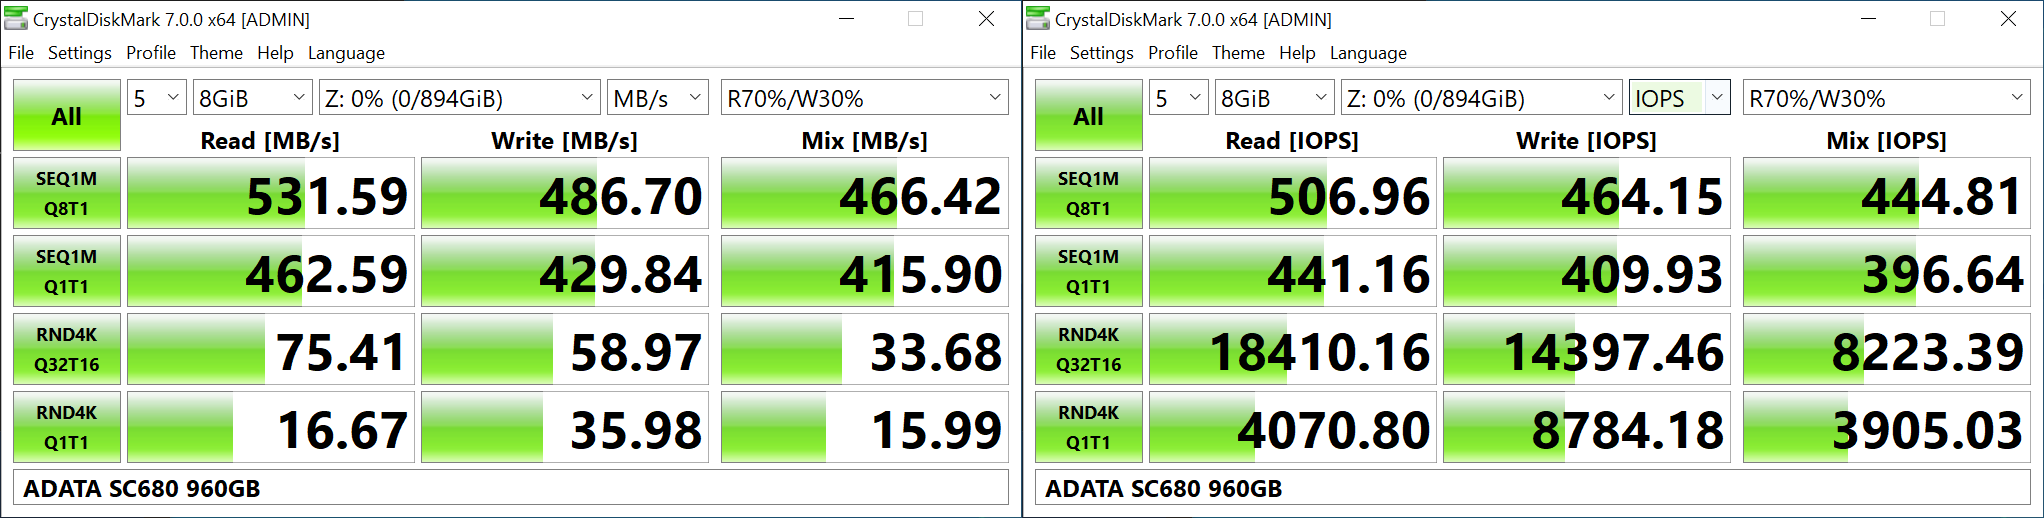 |
CrystalDiskMark provides a better estimate of the performance range with a selected set of numbers. As evident from the screenshots above, the performance can dip to as low as 7 MBps for random writes in the HP P500. The HP P600 provides better peak numbers (554 / 491 MBps) compared to the ADATA SC680 (532 / 487 MBps). The HP P500 clocks in at 350 / 217 MBps for sequential reads and writes.


13 Comments
View All Comments
mark625 - Thursday, September 24, 2020 - link
Is it just me, or is the color you chose for the temperature line in the graphs on the last page actually "transparent"? All I can see is the throughput line (in blue) and the starting and ending temperatures (in red). There is no graph line for temperature.ganeshts - Thursday, September 24, 2020 - link
The lead-up text to the graph explicitly states: " the temperature of the drive was also recorded at the beginning and end of the processing. In earlier reviews, we used to track the temperature all through. However, we have observed that SMART read-outs for the temperature in NVMe SSDs using USB 3.2 Gen 2 bridge chips end up negatively affecting the actual transfer rates. To avoid this problem, we have restricted ourselves to recording the temperature at either end of the actual workloads set."Additionally, temperatures are not available for drives that do not support the read-out (example: HP P500)
Alistair - Thursday, September 24, 2020 - link
I've never had an external drive as bad as the Adata SC680. Stay away. Unless you like 20MB/s after it quickly uses its cache and overheats. Faster to do a backup with a spinning drive. Go higher end for sure. The SE800 or HP etc.AMDSuperFan - Thursday, September 24, 2020 - link
I would like to see them compared to PCIE 4.0 drives. This article is incomplete. Also please put time in seconds. I would like to know how many seconds boot takes, not a random number that means very little.ganeshts - Thursday, September 24, 2020 - link
Please tell me which PCIe 4.0 drive is available as an external SSD.The time in seconds for boot will also have the same relative difference as the MBps rating. Higher the 'random' number, the faster would be the boot time on an ideal system where the *storage* is the bottleneck. PCMark 10 actually replays the storage trace for the process, rather than doing the actual booting. So, any 'time' obtained from a trace replay *may* not correspond to the *actual* boot time on a system.
AMDSuperFan - Thursday, September 24, 2020 - link
Correct. However I would like to know the specifics. If I buy this fast drive. How fast will it go? Knowing the speed in seconds is 0-60. Knowing the MBps rating is knowing the top speed. They don't always mean the same thing. Do I upgrade to one of these from my PCIE4 drive in my AMD computer?Billy Tallis - Thursday, September 24, 2020 - link
"Do I upgrade to one of these from my PCIE4 drive in my AMD computer?"Please stop with the stupid trolling comments.
Luminar - Friday, September 25, 2020 - link
OuchShmee - Friday, September 25, 2020 - link
Interesting, it still seems to me it makes more sense to get a good m.2 or 2.5in drive with an enclosure. Could be faster AND cheaper.jabber - Friday, September 25, 2020 - link
Would be handy to see how a 'Amazon homebrew special' would hold up price and performance wise in comparison. it's the route i would take. Just more flexible.However, in any real world scenario these things will all crawl to KBps speeds as soon as they hit microfiles which are the Achilles heel of modern data systems. We need better file systems to compensate.