AMD Ryzen 9 5980HS Cezanne Review: Ryzen 5000 Mobile Tested
by Dr. Ian Cutress on January 26, 2021 9:00 AM EST- Posted in
- CPUs
- AMD
- Vega
- Ryzen
- Zen 3
- Renoir
- Notebook
- Ryzen 9 5980HS
- Ryzen 5000 Mobile
- Cezanne
Power Consumption
The nature of reporting processor power consumption has become, in part, a dystopian nightmare. Historically the peak power consumption of a processor, as purchased, is given by its Thermal Design Power (TDP, or PL1). For many markets, such as embedded processors, that value of TDP still signifies the peak power consumption. For the processors we test at AnandTech, either desktop, notebook, or enterprise, this is not always the case.
Modern high performance processors implement a feature called Turbo. This allows, usually for a limited time, a processor to go beyond its rated frequency. Exactly how far the processor goes depends on a few factors, such as the Turbo Power Limit (PL2), whether the peak frequency is hard coded, the thermals, and the power delivery. Turbo can sometimes be very aggressive, allowing power values 2.5x above the rated TDP.
AMD and Intel have different definitions for TDP, but are broadly speaking applied the same. The difference comes to turbo modes, turbo limits, turbo budgets, and how the processors manage that power balance. These topics are 10000-12000 word articles in their own right, and we’ve got a few articles worth reading on the topic.
- Why Intel Processors Draw More Power Than Expected: TDP and Turbo Explained
- Talking TDP, Turbo and Overclocking: An Interview with Intel Fellow Guy Therien
- Reaching for Turbo: Aligning Perception with AMD’s Frequency Metrics
- Intel’s TDP Shenanigans Hurts Everyone
In simple terms, processor manufacturers only ever guarantee two values which are tied together - when all cores are running at base frequency, the processor should be running at or below the TDP rating. While manufacturers showcase a rating on the box, motherboard manufacturers often ignore it and use their own settings, based on the motherboard capabilities, making the CPU vendor ratings somewhat useless. The crucial thing is though, the CPU vendors actively encourage the motherboard vendors doing their own thing, creating confusion as to the real power consumption for the workload, and if the frequency on the box is actually what the user is going to get.
For laptops, it gets even worse than desktops. On a laptop, power consumption and frequency control are key parts of the design ethos, however we end up with nested-upon-nested options for power control. While the CPU vendor will have their own power control levels in firmware, the laptop vendor will have another set on top of this in the BIOS, and then the operating system will have another set on top of this, followed by another layer of laptop vendor software. Its turtles all the way down, and each variation produces something quite different.
AMD recommends that all the power levels be left where they are, and the user only controls the vendor software power options. In this case ASUS offers two modes: Silent and Performance. We mentioned these on the first page of this review, and showcased some odd numbers. It might be more striking if I just show the comparison.
To start, I’m simply going to showcase what a full sustained 10 minute CPU load does, first in Performance mode.
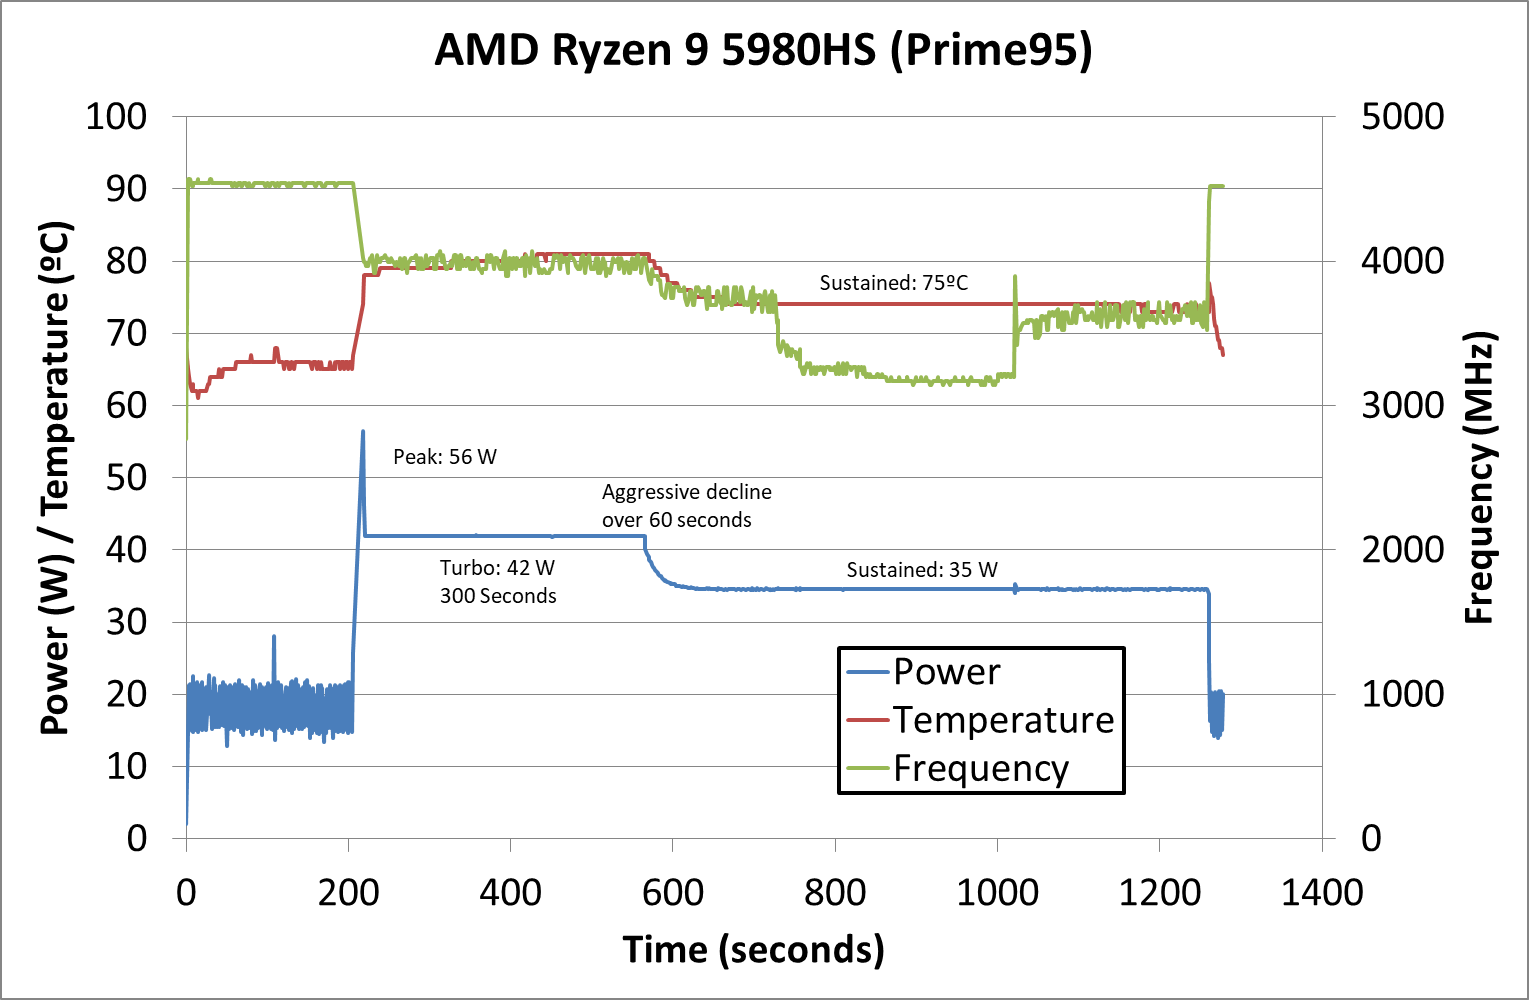
P95 is a heavy AVX workload for this processor, and in performance mode we see the processor peak at 56 W for a couple of seconds, and then hit its turbo mode at 42 W for 300 seconds. During this time we’re around 4000 MHz on all eight cores and sixteen threads, and the system cooling is keeping it around 80ºC. Once the 300 seconds has finished, the system slowly decreases to 35 W and 75ºC over the course of 60 seconds, before hitting a consistent 35 W. The frequency bounces as low as 3200 MHz, likely in line with the instructions from the test.
Now similarly, let’s go to the same benchmark in ‘Silent’ mode.
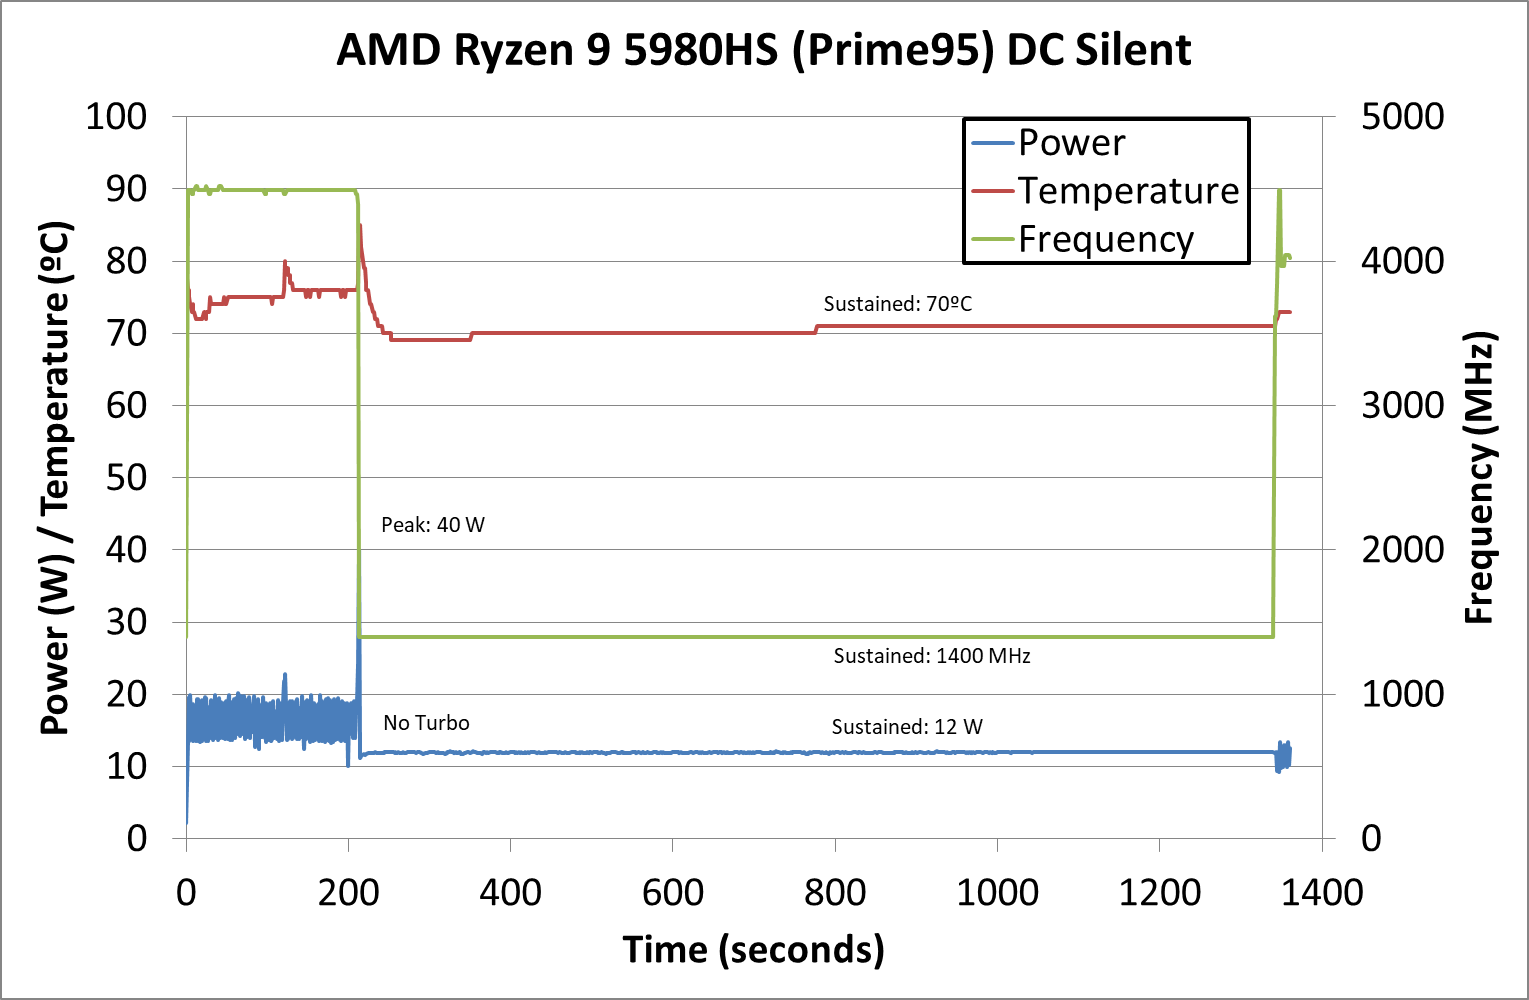
This looks a lot different. Here the system is prioritizing noise over anything else, and that also means reducing voltages and frequencies to the point of absurdity. There is no turbo to speak of in this workload, and the system comes down to 1400 MHz sustained at 70ºC and 12 W. This is still all eight cores, and the system is still quiet, but that is the tradeoff in these designs.
Moving to a more user-friendly workload, Agisoft, which is a mix of ST and MT.
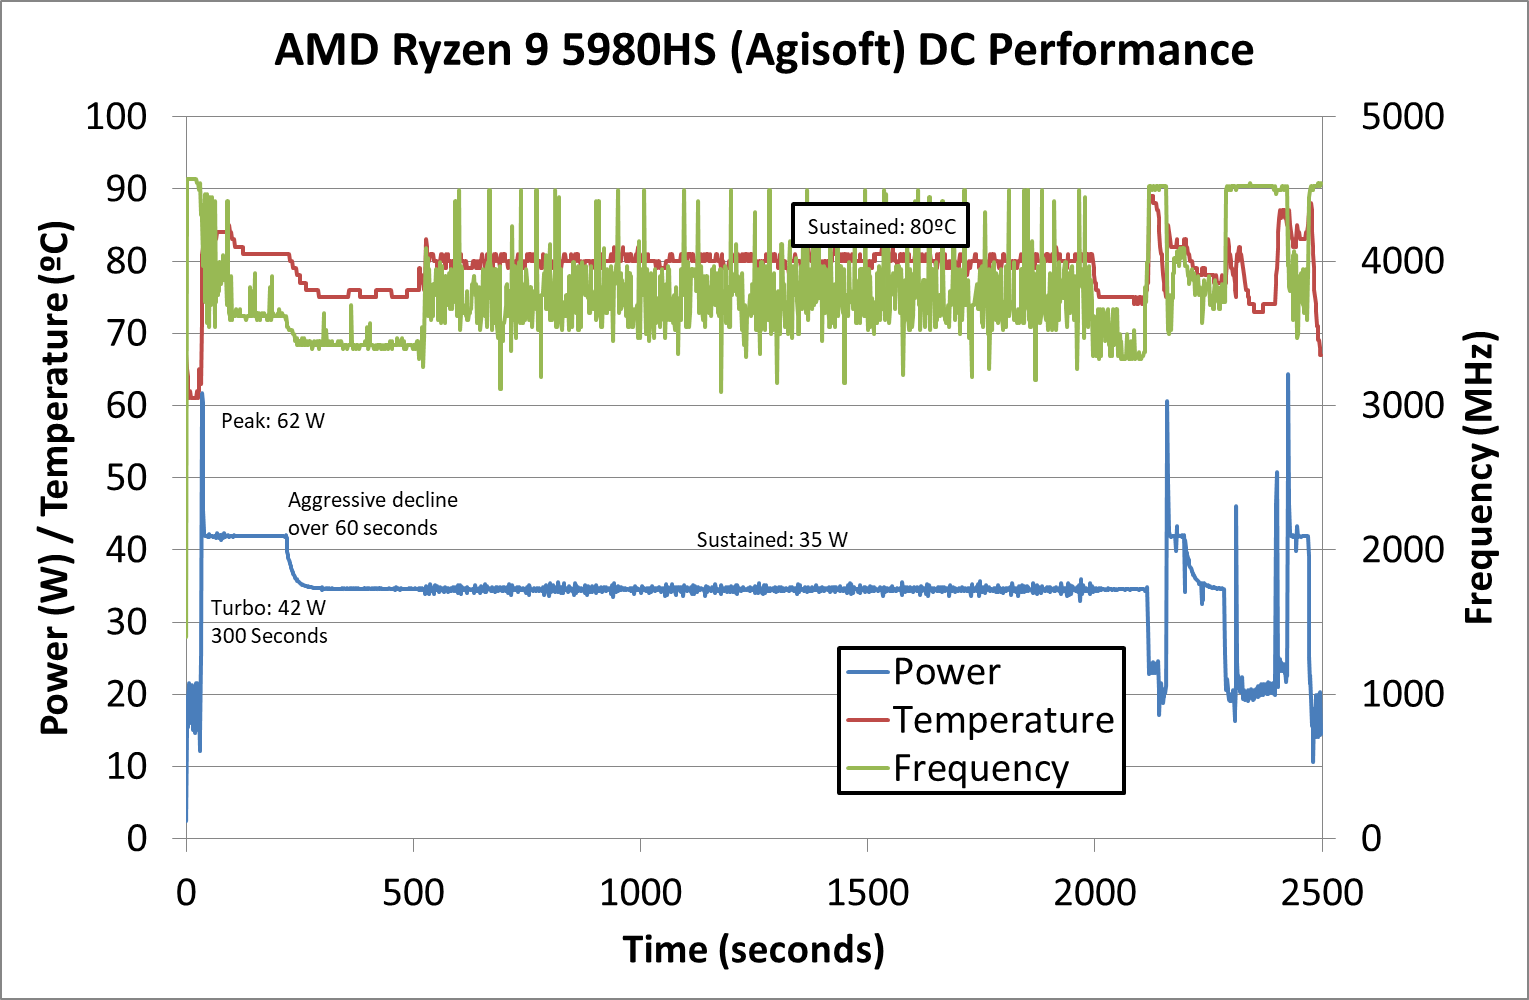
At the start of the test we see the power peak at 62 W for a second or two, before coming down to a 300 second turbo of around 42 W. During this time the frequency comes down to around 3650 MHz, before reducing to 3400 MHz as the turbo budget runs out and the system drops to 35 W for a sustained mode. The second part of the test, which is multi-threaded, starts at around 500 seconds and showcases a sustained temperature of around 81ºC and an opportunistic frequency peaking at 4500 MHz, all while staying at 35 W. Towards the end of the test, as we start looking at single threaded workloads, the system peaks above 60 W on two occasions, but also shows 4500 MHz for ST activity. The CPU temperature rises more to 90ºC as the preferred core is used, but as it is only a single core the thermals are better managed and adjust accordingly.
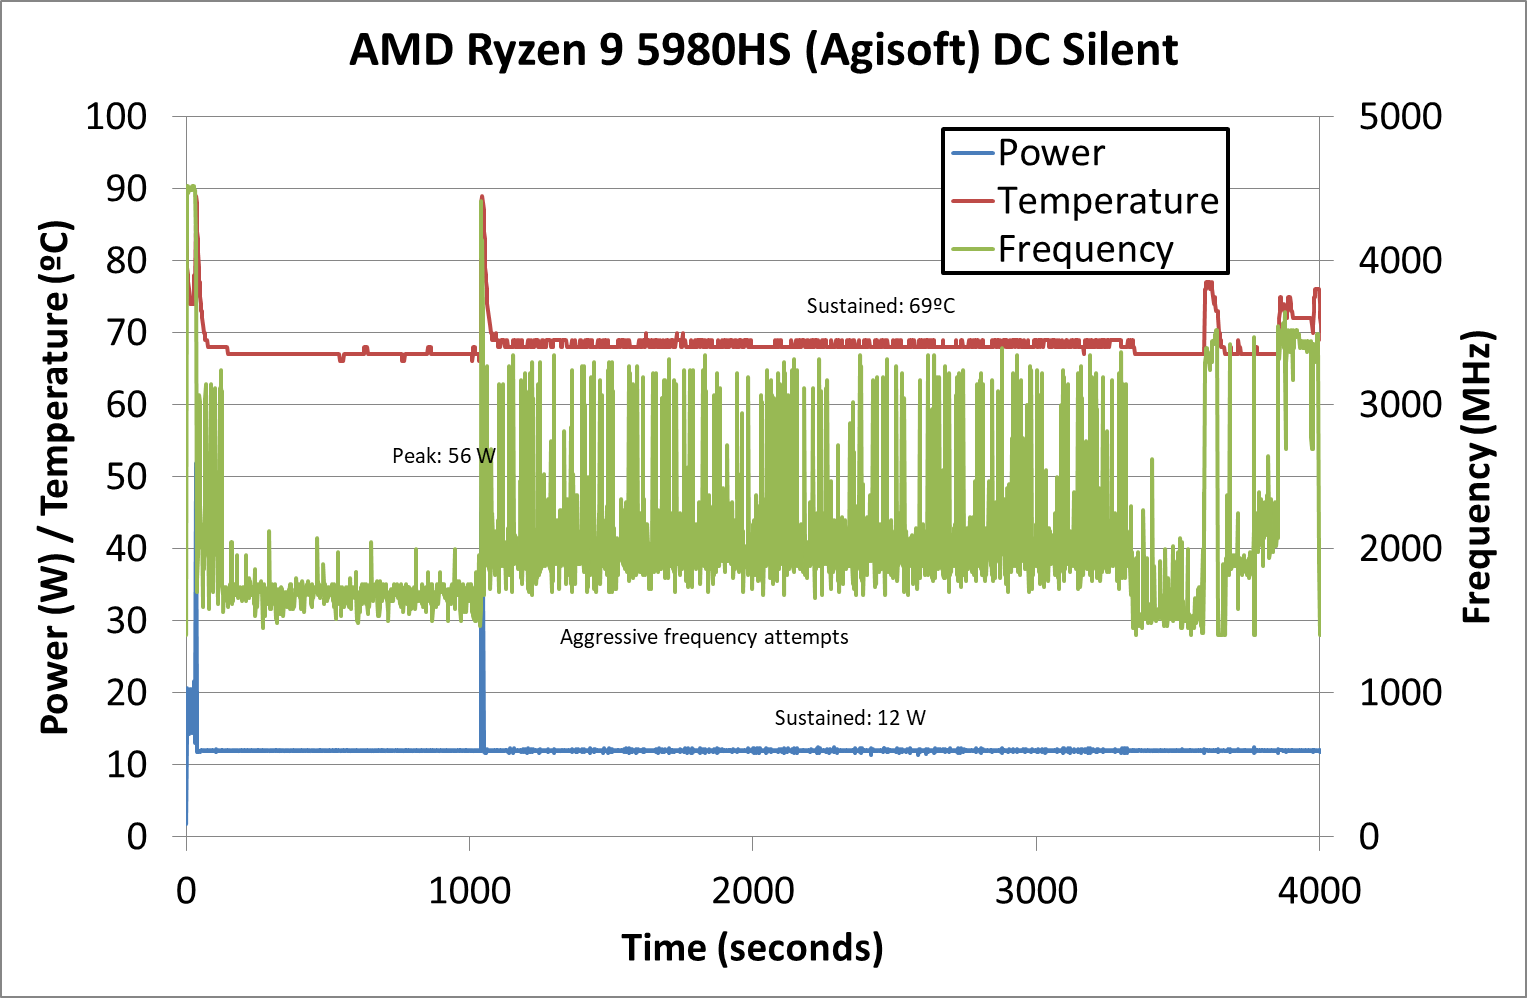
The same workload in silent mode stays at 12 W for almost the entire test. We get a couple of peaks to 56 W, but the system tries to both stay quiet and stay around 68-69ºC by reducing frequency and power. The CPU still tries to remain opportunistic as we can see from the very spikey frequency graph in green, but it is in the region of 1700 MHz to 3300 MHz for most of the test. So while it takes 2443 seconds in performance mode, the same test takes 4059 seconds in silent mode.
This is probably showcasing the worst performance disparity between the two. In a lot of CPU tests, as you’ll see in this review, the differences can be minor. It showcases just how important it is to profile what workload you are running, and keep a close eye on what performance mode the system is running at (there isn’t a clear sign without actively checking the software).
Suffice to say however, in these tests, we do see a peak of 62-65 W on the Ryzen 9 5980HS. It is for all intents and purposes the briefest of spikes, and we don’t necessarily see any thermal increase to the extent that another 10 seconds of workload at 42-45 W does. The sustained turbo mode for 300 seconds is an impressive turbo mode that allows for higher frequencies in most workloads, with only the super sustained tests that might be more at home on a workstation or 15-to-17-inch notebook causing the processor to hit 35 W TDP. It also comes down to thermals, and given the design and temperatures we’re seeing, the ROG Flex 13 is very much a notebook, than a ‘laptop’. Users looking to actually use it on their lap would probably be best creating a thermal profile that keeps the temperature low at the expense of fan noise. When we examine the laptop in further detail, we’ll cover the issue of fan noise.
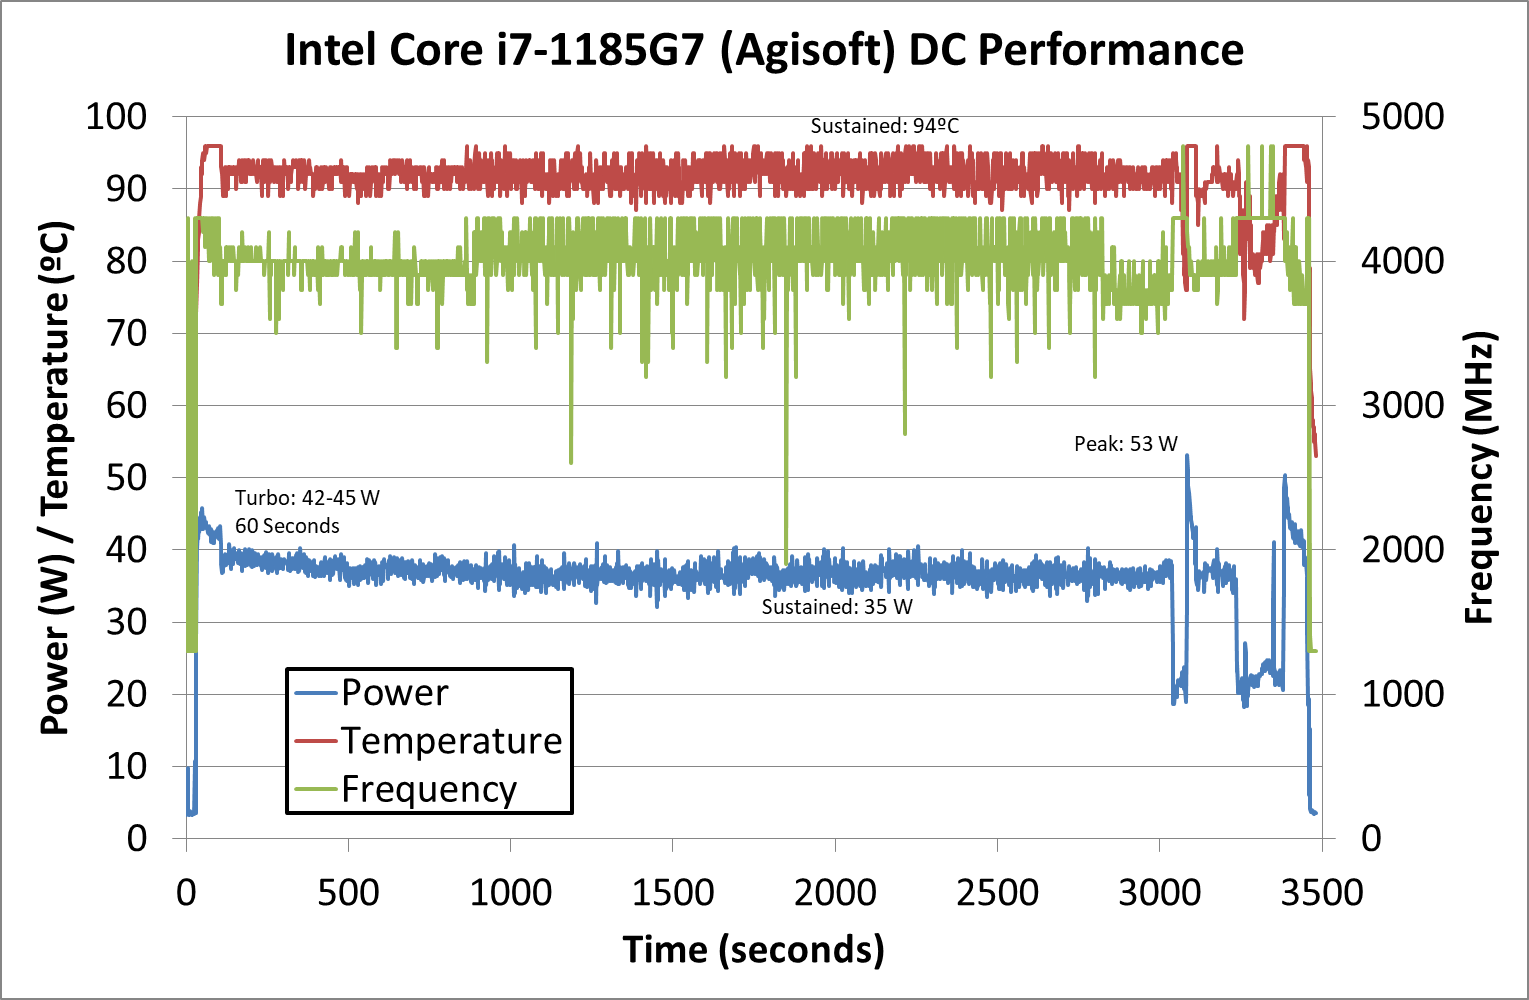
For completeness, here’s the Agisoft graph for the MSI Prestige 14 Evo in performance mode. Intel enables a turbo of 60 seconds, on which we see 42-45 W, although the peak observed is 53 W later in the test. We do see a sustained 35 W mode, averaging around 4000 MHz on all four cores. But what is perhaps worrying is the temperature, being reported as a sustained 92-94ºC on average. That’s quite high. Where the Ryzen 9 5980HS takes 2443 seconds to complete the benchmark, the Intel system takes 3389 seconds.


218 Comments
View All Comments
Samus - Wednesday, January 27, 2021 - link
The 1660Ti has a higher TDP than the entire POWER SUPPLY of these test systems...GeoffreyA - Wednesday, January 27, 2021 - link
"1660ti or better is mandatory for any decent gaming"The iGPUs are a blessing to many people, especially those on a slender budget, like myself. One can actually play games on these and have a lot of fun.
ZoZo - Tuesday, January 26, 2021 - link
Indeed I didn't base my statement on the results in this test. I thought I remembered seeing 15W Tiger Lake vs 15W Renoir giving an edge to Tiger Lake.yeeeeman - Wednesday, January 27, 2021 - link
this test is comparing a 35W part iGPU to a 15W part iGPU. 1185G7 beats 4800U iGPU..schujj07 - Wednesday, January 27, 2021 - link
The only 15W CPU in this iGPU test is that of the 4800U. The 1185G7 is 28-35W and the other Ryzen's are 35W. The 4900HS has a RAM speed deficiency on the 1185G7 and wins 4 out of 7 tests.mikk - Thursday, January 28, 2021 - link
Because they are mostly CPU bound, it's primarily a CPU test! Look at the resolution. Anandtech lowered the resolution to 360p-480p low details in some of them to give Vega a chance to beat Xe. Furthermore Vega needs to clock at 2100 Mhz, a 55% clock speed advantage. No AV1 decoding either which is another big flaw for a mobile device.Spunjji - Friday, January 29, 2021 - link
@mikk - Pretty sure those results still aren't CPU bound, otherwise they'd be in the 100+fps range - and you'd expect Intel to win under those circumstances, because of their high single-thread performance. If Intel's iGPU only "wins" when they're both running sub-30 fps then it's a fairly meaningless win."Vega needs to clock at 2100 Mhz" - irrelevant. High clocks is only a disadvantage if it leads to worse power consumption, and that's not the case here. If Intel can increase their clocks within the same power envelope then they should.
Lack of AV1 decoding is a downside. It's not clear yet whether it will be a major one, but it shows the age of AMD's solution.
dotjaz - Friday, February 5, 2021 - link
That's called competition, honey. Don't have to beat it.Spunjji - Thursday, January 28, 2021 - link
You could have read the review to see that's not true. Xe routinely loses to Vega 8 in actual games, albeit not by a significant margin.Tams80 - Monday, February 1, 2021 - link
Xe does beat it, no doubt. But it's still pretty close and for integrated graphics Vega is good enough for another year.As mentioned in the article, they probably used Vega again mainly to ensure a quick release.